How To Track The Content That's Shared Via Email

If you had to guess, where do you think most sharing of asset management-created content takes place—on social networks or via email and other non-social means?

EmailDarkSocial.jpg

My guess (and yours, too, I’ll bet): Our enthusiasm for social media notwithstanding, most of your content is shared via email, instant messages and message boards, etc. Email, in particular, is the most widely used communication channel and one where the sender can control both context and, to some extent, audience. 

The sharing that takes place via non-public (and believed to be un-measureable) exchanges was dubbed “Dark Social” by Atlantic Senior editor Alexis C. Madrigal last fall (an idea so interesting that it was one of my “20 Content Highlights To Remember From 2012.")

It’s especially germane to this business where, like fund company products, the vast majority of mutual fund and ETF content is distributed not directly by fund companies but by intermediaries. Wouldn’t you like to know the percentage of your site traffic that comes from individuals sharing links in emails? Or even the site content that's being called out in emails from financial advisors to their clients and prospects, for example? 

There is a way to get a handle on this, as identified by a few blog posts I’ve been reading lately, the highlights of which I want to share with you.

Direct Traffic Unbundled

When a financial advisor (or somebody else) includes a link to a page on your site in an email and the receiver of the email clicks on the link, that traffic is today being counted by your Web analytics. But in all likelihood, it’s being reported as direct traffic, and that’s what needs to be more closely examined.

For insights into the content that’s being shared—with sharing serving as a measure of the value of the content that you’re creating—you need to dig a little deeper into what's being attributed as direct traffic.

The classic definition of direct traffic is traffic that comes directly to your site. The assumption is that the visitor typed the URL into the browser or used a previously set bookmark. But, take a look at the specific pages for which direct traffic is reported as the referrer to your site.

Is it realistic to expect that someone arrived at your site by typing every character of those long, hairy URLs that many fund companies are unfortunately burdened with?

Example: https://performance.yourdomain.com/web/yourfundcompany/products-performance/mutual-fund-details/details/19765J624/mutual+funds/Intermediate+Municipal+Bond+Fund+A/Class+A

Probably not. The link to this page was either copied and pasted into an email or other communication (more likely) or bookmarked (less likely).

While it will be far from exact, it’s relatively easy to identify Website traffic that is sourced by email and other Dark Social sources. You just need to segregate the traffic that went straight to your home page—that’s probably the true direct traffic—from the traffic that went to pages deep in your site.

This can be done with any Web analytics package.

Segment Using Google Analytics

Here are two options for doing it with Google Analytics.

If you want to assume that all traffic that came directly to pages other than the home page was referred by Dark Social sources, click on this link while signed into Google Analytics.

You’ll see a page with the image below. Choose your profile (if you have access to more than one) and then select Create.

AdvancedSegment.JPG

You’ll then be taken into Google Analytics, where you’ll see the image below. Save the segment and you’ll be able to view Dark Social as one of your available custom segments.

DarkSocialBroad.JPG

For a more narrow approach, click on this link as provided by the Gravity Search Marketing blog. It filters the home page and any subfolder with four characters in it. (This uses regular expressions—if you're not familiar, see the primer ebook I came across in March.) 

As noted in the post, if you promote marketing URLs with subfolders (such as www.yourdomain.com/micrositename), then you’ll want to refine this by excluding those from the Dark Social segment, too. You might also want to further refine by excluding product pages or by including only types of content (e.g., investment commentary or blog posts.)

This analysis is worth doing. Based on what I’m seeing in the analytics profiles I am privy to, your Dark Social traffic could represent anywhere from 10% to 30% of your overall traffic. It’s an overall, if crude, measure of the resonance of your content and will give you some perspective on which specific product and content pages are being shared. 

What Are The Most Downloaded Asset Manager iPad, Android Apps?

Mostly, I just want to call your attention to App Annie, an app analytics site that I learned about last week. If you've ever been frustrated trying to get app download data, this site is a dream come true. There are other sites out there, but this one provided what I was looking for, at no charge.

App Annie aggregates data from the iTunes (reporting on iPhone and iPad apps) and Google Play (reporting on Android operating system apps) stores, and ranks apps. Data from the Amazon and Windows app stores is in beta but irrelevant to the asset management app space today anyway.

USAA On Top Of The Charts

The USAA app (with investment content and functionality as well as banking, mortgage and insurance content) sits at the top of what I'd consider relevant investment apps in the Finance category. Note that App Annie publishes rankings, not numbers. According to the USAA app download screen in the Google Play store, USAA has more than 1 million downloads.

Here’s a screenshot of the rank history of USAA’s Android app. You can see that the app has consistently ranked in the top 10 of Finance apps and since mid-2012 has been in the top 500 Android apps overall. The bubbles on the x axis mark new releases. Similar graphs are available for iPad apps. Well done, USAA!

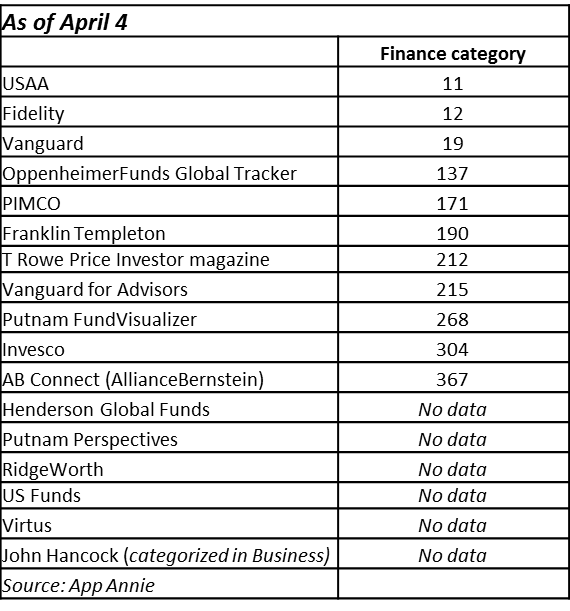
When I visited App Annie, I couldn’t resist using it to build a ranking of asset manager apps in the Finance category and thought I’d share the list with you.

If you check out the table below and then proceed to the site (free registration required) and browse the individual app pages yourselves, you'll see added information that will be helpful when conducting your own research.

Relative Rankings May Matter More

Here are a few observations:

  • The Finance category in both stores is big and broad, including media, banks, brokerages, online financial management sites, etc.

  • Only USAA (#11 in iPad apps and #8 in Android apps), Fidelity (#13 in iPad apps and #24 in Android apps) and Vanguard (#23 in iPad apps and #62 in Android apps) are serious contenders in the Finance category. No matter, the rankings can provide insights on your competitive set or subset. While you wouldn't expect a financial advisor app to place high among all Finance apps, you'd be interested in how it does relative to other advisor apps, for example.  

  • In the weeks leading up to the April 15 tax filing deadline, the rankings of the tax preparation and financial management apps were probably enjoying a boost.

  • A spokeswoman told me that App Annie ranks only apps that are in the top 1,000 of their category. The apps with No data shown don't make the cut.

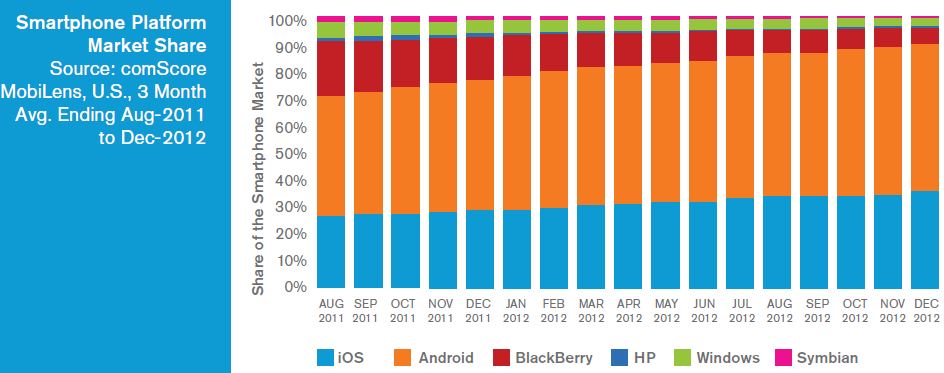
  • I could find mention of only seven Android asset manager apps and only four with reported data. According to Comscore earlier this month, Android has 52% share of the smartphone platform. I fear that some of you are overlooking and underleveraging the platform.

  • Almost all asset manager app rankings drop over time. I can think of at least two possible explanations for their declines: 1. More apps are being launched, and they are more compelling. 2. Most asset managers do a sorry job of consistently promoting the availability and value of their apps. 

  • The higher ranking asset management apps tend to update more frequently. Chicken or egg?

What are your reactions? Are there other asset manager apps that should be part of this list? (Seriously, is this all there is?) Your comments are welcome below.

Asset Manager iPad App Rankings

Asset Manager Android App Rankings

5 Ebooks For The Digital Marketer To Curl Up With

You’d never know it from my behavior at Costco but I’m no pushover when it comes to free samples. I do have a discriminating eye. Lately, my eyes have landed on some excellent ebooks and whitepapers that I recommend. And, their price is right, although a few will require your contact information.

The Digital Marketplace: An Overview

You know how it is when you’re just looking for one piece of data—smartphone market share, let’s say. For an update on the lay of the land and some interesting statistics (see page 34 for the mobile market share), you can’t do much better than to turn to comScore’s U.S. Digital Future In Focus 2013 as a resource. The 46-page report was released in February.

Read More

9 Random Stats Cherry-Picked Just For You

The last few weeks have seen the release of some fascinating and free research and work. I cracked open the reports to pull out the following nine numbers that made an impression on me and might on you.

10.8

Financial advisors say they’re working with about one additional mutual fund provider in 2012—10.8 versus 9.9 in 2011—and that they’re concentrating fewer assets with their top three providers.

This is just one of many insights offered in “A Fresh Look at Advisor Loyalty” from Cogent Research. The report, which you can download, also analyzes aspects of the product and service experience that are most likely to drive advisor loyalty across three types of products: mutual funds, ETFs and annuities.

Read More