If Being Visual Isn’t In Your DNA, Change Your DNA

“Being visual just isn’t in our DNA,” one workshop participant pushed back by piping up. “We can do words—lots of words—but we don't do pictures,” she said as her colleagues nodded in solidarity.

OK, that’s a belief that has been too prevalent and if it’s afflicting your organization, you need to stomp it out. DNA can be changed (see this New York Times report, for example) and so can the way every mutual fund and exchange-traded fund (ETF) firm communicates. "To be visual" simply requires conviction and resources that include bigger fonts and brighter colors. You can do this.

This post revisits a favorite topic (see the July 12, 2012, “Asset Managers Start To Say It In Pictures”) but with added urgency. The most dramatic recent change to content posted to asset manager Websites—and especially to blogs, those insatiable beasts—has been in the visual appeal of the content.

To be sure, many firms are still extracting those sad scans of grayscale charts used in previously created (!) documents and passing them off as visual relief on all-gray Web pages.

But, more and more marketers are reading the memo—visuals help the brain process information, essentially facilitating communication.

source: optimaltargeting.com

source: optimaltargeting.com

The image above is an excerpt from a larger Optimal Targeting infographic called "The Future of Marketing." Yes, that's how important images are to marketing. Others’ visual communications competency is evolving and yours must too if you expect your customers and prospects to pay attention to what your firm has to say in 2015.

For one window into the very best graphics being published by asset managers, check out the social media accounts of your competitors or firms you have a particular interest in.

You’ll get an idea of both the content the firm is publishing and what’s getting shared. You may be surprised. If your content isn’t visual and inviting, it’s getting much, much less social support. The screenshot below shows the Photos & videos tab on the @JPMorganFunds Twitter account, as an example.

Here’s a quick review of some of what I’ve been noticing, in my visits to Websites and following social updates.

Keeping It Simple…

Simplicity is the key to this Nationwide Funds small caps vs. large caps graph shared on Twitter. There’s no proprietary data here, any fund manager could create this chart and many do. But the team behind this graph made a smart decision to downplay or even eliminate all but the necessary data points. 

This stripped down version makes it possible for followers to get the main point from the visual as they encounter it in their tweet stream. The underlying Website contains all required information.

This Prudential Investments chart is another example of, when possible, less is more.

…And Quick

In fact, visuals don’t necessarily have to be made in-house. When time is of the essence, AdvisorShares (and other firms) regularly relies on screenshots of trading screens to make a point.

Dense With Data

Then again, some firms are taking the time to produce data-based interactives for their sites.

For example, here’s Putnam’s chart on the U.S. labor market recovery. Nothing about these—not the creation and maintenance of the graphic or the user’s consumption of it—is simple and quick.

Assuming your visual expounds on something of ongoing interest, a data-dense chart could be a consistent contributor for you. It could draw attention to your site and foster engagement.

And, given that the year is 2015, whatever you do has to look good on a smartphone, too. See how well the Putnam graphic works when shrunk to fit a phone in portrait mode.

Spare The Word, Save The Reader

If there ever was a firm with visual DNA, it would have to be Russell Investments, whose Economic Indicators Dashboard has been a thing of beauty for years. Note how few words are used in Russell’s newer Market Expectations graphic.

Spare The Word, Save The Reader, Part 2

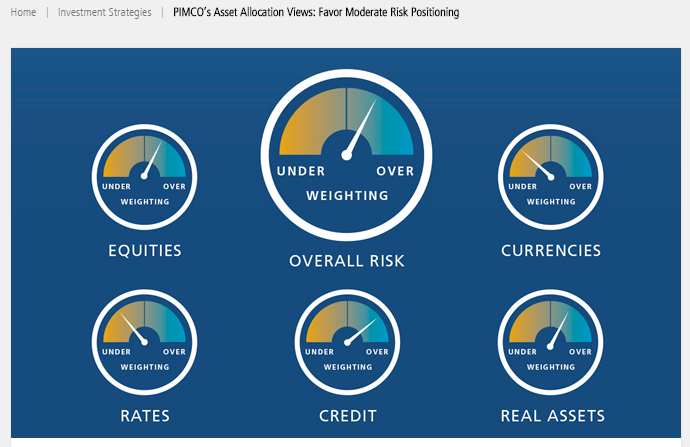
But even PIMCO, home of the long form narratives, is going visual. Having first appeared in a PDF at the beginning of the year, this updated Asset Allocation Views graphic now appears on the PIMCO blog.

As if inspired by Cliff's Notes, this Fidelity graphic provides five takeaways of a wordy business cycle update. The image appears on the update page on Fidelity's site and was used in a tweet. What about this couldn't you do?

Show A Little Love To Product

Finally, these charts from OppenheimerFunds offering “good reasons to avoid timing the senior loan market” serve as a reminder to extend your visual capability to product communications, too.

In this case, when the visual on the Website itself needs to be enlarged in order to be appreciated, it obviously won’t work as a social-worthy graphic. That’s when you need to create a separate image, probably a subset of the larger image, to share. It's an extra step that will be worth your time.

Now For Something Different: Morningstar’s Performance Clock

The old way involved closed doors, guarded discussions and hushed voices until an organization was ready to unilaterally spring change on its business partners and customers. (And we wonder why that didn’t always work so well?)

That’s not how change is introduced today. More often than not, the new way starts with an idea—sometimes not fully baked—and involves pilot tests, trial balloons, beta launches and other forms of vetting by "the crowd."

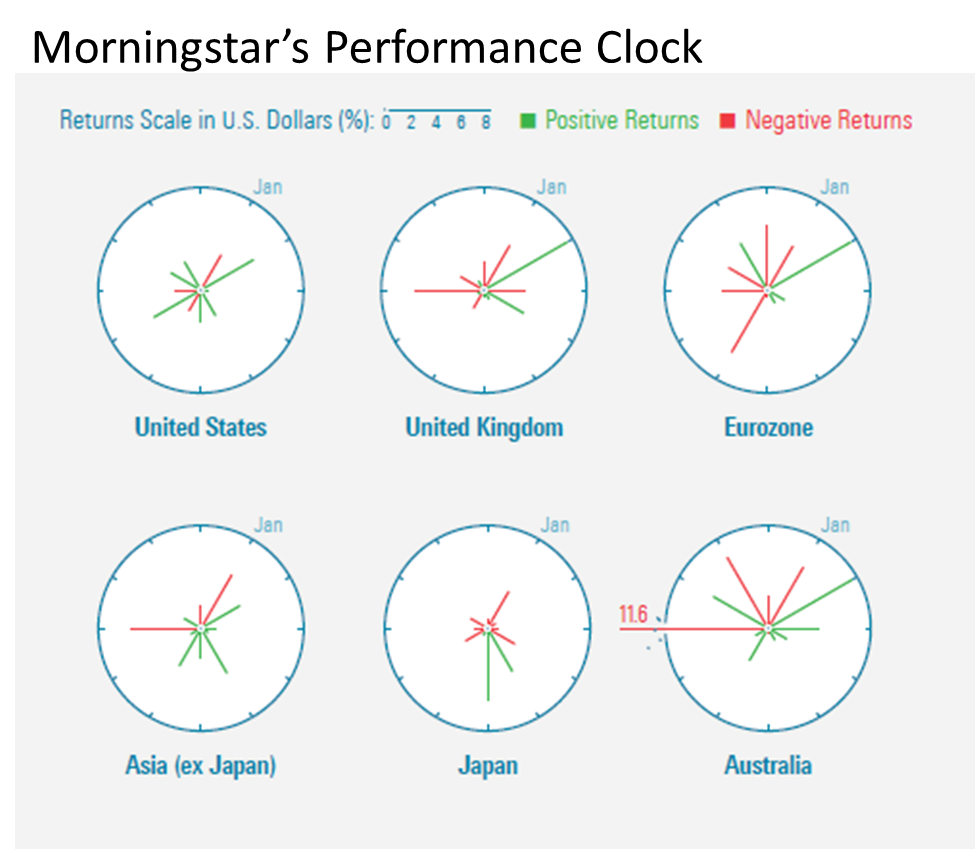
For example: Have you seen the “performance clock” published in the February/March 2015 Morningstar Magazine? This link will open page 34 of Morningstar’s Nxtbook magazine reader, you might need to give it an extra second or two.

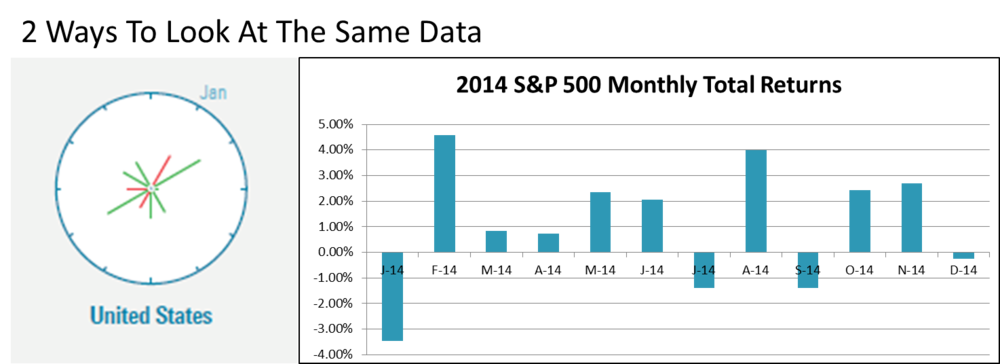
The performance clock offers a different way of looking at monthly returns of indexes or securities over time. It appropriates the face of an analog clock, showing monthly returns for the 12 months of a calendar year. The length of each line shows the absolute performance for each month. January is at the 1 o’clock position. Green lines present positive months and negative months are shown in red. When the returns or losses are small in some months, the lines very short.

“We’re thinking of making it a regular feature in our Data Dashboard toward the back of the magazine,” Editor-in-Chief Jerry Kerns told me in a response to an email I’d sent. “It would track the performance of [market] indexes throughout the year.“

In the note accompanying the feature in the magazine, Kerns asked for feedback, including whether Morningstar software users would want to see an interactive visualization. Per the new way, why invest programming resources unless there’s some demonstrated user interest in it?

Morningstar acknowledges that the visualization conveys the same information as a standard bar chart. In answer to a direct question from me, Kerns said, “I think it could replace monthly bar charts. It hammers home that volatility comes not just from the downside.”

Kerns elaborated, “I think the clocks work best when they’re being used to compare or provide context. Say that the performance of two funds with similar mandates is correlated—both funds produce positive and negative returns during the same months. But what if one fund was more volatile—its up and down months were more extreme? The performance clocks of these two funds, presented side by side, would show that. The volatility of the one fund would really stand out.”

I like the clocks and found myself spending much more time with them than I would with bar charts. I appreciate new efforts to aid investor understanding. At the same time, I should admit that I’m a pushover for whatever's new.

Does The Clock Toll For You?

Every mutual fund and exchange-traded fund (ETF) marketer knows to keep an eye on what Morningstar’s up to. In fund communications alone, we have Morningstar to thank for introducing the style box (in 1992, according to this corporate PDF) and of course there are the star ratings that appear on most fact sheets and fund profile pages.

I wouldn’t rule out the possibility that a new and improved visualization from Morningstar might eventually influence your presentations of market or fund performance.

Who else has a say in how fund companies present data? The financial advisors who distribute your products, the wholesalers who represent them, FINRA, Compliance, your fund data automation vendor, in-house designers all have a stake, too.

Just to test the waters, I reached out and asked Synthesis and Kurtosys, two marketing communications automation solutions providers mentioned here before—see this post and this—for their reactions. These people are information design professionals, with the battle scars from having to automate scads of data, graphics and text for an array of asset manager communications. They are not easily impressed.

“How would the performance clock work, either in fund fact sheets or online?” was what I wanted to know.

Some Reservations

Stipulated: There’s no doubt that a tabular presentation of fund return data is the most complete information a fund company can provide. If the clock visualization was used to present fund performance and/or index performance, it would likely be supplemental as most fund company graphics are.

Even so, the fund automation vendors have their reservations.

On the plus side, said Synthesis product manager Noel Rodolfo, “One of the benefits of this chart is that it should take up less real estate than a bar chart (even with data labels added, as I would suggest). And the clock hands’ length is the absolute value since positive/negative is denoted with a color. Nice, that will save some space.”

However, Rodolfo noted that reliance on color alone for positive and negative returns will be a challenge for the color blind. Ultimately, he thinks a benchmark comparison—involving two clocks side by side—will be more difficult and take the user too long to analyze the differences.

“I’ve seen these charts used by the fund ‘technicals’ on an institutional level, at French and Swiss firms mostly,” said Matt Stone, marketing director for Kurtosys.

Stone called clock charts interesting but confusing. “They save space and can help report on seasonality, but they are frighteningly hard to read for most. Both the positive and negative values go in the same outward direction.”

Stone said Kurtosys doesn’t see much reinventing of the wheel related to fund performance. On the other hand, marketers are turning to infographics for “the freedom to experiment and be more original. But the aim,” Stone reminded, “should always be to provide clarity, precision and efficiency.”

Your turn—whether you’re a marketer, financial advisor or Other—to weigh in on the performance clock. Your comments are welcome here, of course. You might also want to share your thoughts with Kerns. After all, early response from our crowd should be the benefit of Morningstar’s providing a first look. 

14 Investment Company Content Highlights Of 2014

Pay no attention to the graph below that suggests my excitement on Twitter plummeted from its high at the start of 2014.

ExclamationPoints2014.png

I begin the Rock The Boat Marketing annual round-up of favorite content super-optimistic (is that better?) about the quality and range of content that I stumbled upon this year. So much so that I can finally limit this list to content highlights produced by and about the asset management industry alone.

That’s a change from previous years’ lists (2013, 2012, 2011, 2010), which included a handful of investment industry examples along with mainstream content gems. This year someone else can cover the Adele Dazeem Name Generator aka Travoltifier.

Unchanged is the need to acknowledge straight away that there’s no identifiable criteria being applied here. My favorite content, numbered below and yet in no particular order, made an impression that continues as much as 12 months after I first saw it. Whether it broke new ground, introduced new ideas, deepened my understanding or changed my mind, I found myself returning to this content, emailing links to it and finding a way to work it into presentations. 

1. Thank You For That Nice Introduction

Not so long ago, tampering with an investment company logo might well have been a fast way to meet the brand’s legal representation. The brand would never have publicly acknowledged yet alone embraced whatever travesty might have occurred.

That was then.

When, in February 2014, Jimmy Kimmel Live created a Kidelity Investments, Fidelity jumped on board. On Facebook and on Twitter, it shared the video and then deftly sought to use the mention to its advantage. Well played, Fidelity.

First the video and then the tweet.

2. Finally An Answer: About 3%

The rise of the “robo advisor” dominated financial advisor news this year, sharpening the advisory community’s focus on the value it provides.

Vanguard stepped up to help quantify the value in what has to be among the most valuable insight advisors were offered by asset managers in 2014.

Putting a value on your value: Quantifying Vanguard Advisor's Alpha was published in March (the table below is an excerpt from it).

3. And Where Did The Money Go?

This infographic is genius and yet why didn't anyone think of this before? We've all seen, produced and updated the classic Asset Classes Returns matrix chart (at right is J.P. Morgan's).

In February, Kurtosys presented 10 years of fund flows into various asset classes. Shown below is just an excerpt.

4. The Keynote Speaker Becomes A Meme

Just before the mainstream adoption of social media, the event experience was getting a tad predictable, wasn’t it? Presentations prepared weeks ahead were delivered by expertly polished speakers, most of whom seemed oblivious to the audience. They were on, they were off and then they were on their way to the next gig.

Social media gives conference attendees a voice, thereby introducing an accountability edge to the experience. Plus, event content-sharing includes the stay-at-homes who can easily follow along.

BillGrossMeme.JPG

The Morningstar conference machine was humming along that day in June when PIMCO’s bond king Bill Gross took the stage wearing sunglasses and delivered some far-reaching (from The Manchurian Candidate to Kim Kardashian) remarks.

Before social media, reporters would have reported on Gross’ comments, of course. But I believe the sustained social attention—including the industry’s very own meme created by Michael Kitces—ramped everything up.

It seemed to set in motion the events that culminated in Gross leaving PIMCO for Janus, a September episode that was riveting to watch and, for some of your firms, benefit from.

5. Take Your Time, Stay A While

This was the year that asset managers joined other brands in wading into what’s called native advertising—content sponsored by an advertiser that looks as if it could be editorial.

One of the best examples has to be Goldman Sachs Interactive Guide to Capital Markets. The guide debuted on the New York Times site in February and now also lives on Goldman’s.

The top metric on this, according to what Amanda Rubin, global head of brand and content strategy at Goldman Sachs, told Contently, is time spent.

6. Act Like You're Human

Easier said than done, especially if you’re a quanty portfolio manager, or at least that’s been my observation. That’s why this Van Eck portfolio manager selfie from October tickled me.  

Ellen De Generes and her Academy Award cronies are actors. Mugging for cameras is what they do, we shouldn’t be surprised. But when money managers think to use (or even if they were cajoled) a relatively new platform to be social and show a little personality, that’s cool.

Nobody retweeted this, though, it’s often pointed out to me. While that’s true and I wish someone had if only to encourage Van Eck, it’s not always about the retweet. Imagine seeing this tweet in your stream—four guys squeezing into the frame while taking care not to obscure the bridge behind them. This is cute. My bet is that it prompted a smile from those who did see its one and only appearance, making the kind of incremental positive impression that can be achieved on Twitter.

Sometimes you just deliver a message, you don't always get a receipt.

7. How Soon Before We’re Really All Working For Google?

In his searing contribution to the otherwise jolly What To Give The Mutual Fund, ETF Marketer—9 Elf-perts Weigh In post (vive la difference), RIABiz’s Brooke Southall made the point, “Asset management has enjoyed one of the great business models of the past 30 years—with high profit margins and terrific scalability…[But] the need to market like your lives depend on it has come to the fore.”

Google.jpg

While Brooke’s focus was on the uninformed purchase of online advertising, it applies, too, to what may be the most intriguing story of the year: the Financial Times’ September report that Google two years ago hired a financial services research firm to assess how to enter asset management. 

In your work optimizing your sites for search rankings, including via mobile devices, digital marketers may already feel as if they're working for Google.Here's a short list of possible advantages that Google could enjoy as an asset manager:

  • For investing, data on search volume for specific words or phrases to time the market 
  • For investing, use of its satellite imagery to predict company earnings
  • To distribute other firms’ funds
  • For relevant, even personalized marketing based on what it knows about individuals' search patterns

Watch this space. 

8. Yes, Do Dignify With A Response

When something critical is written about an asset manager, the standard response is to turn the other cheek, to not engage. But there may be times to do the opposite, given the long life of discoverable Web pages.

This year saw a few firms standing up for themselves in public ways.

To wit: 

  • In September, AdvisorShares distributed a press release about a five-star rating on one of its ETFs. In response, ETF.com writer Dave Nadig cautioned readers not to be "starstruck" about that fund. And, AdvisorShares CEO Noah Hamman took to his AlphaBaskets blog to respond to Nadig point by point. Wow.
  • No mutual fund company takes on Morningstar just because. But Royce Funds’ apparent frustration (“while both our investment philosophy and process, which date back to 1972, have remained steady over the years, most of our funds have experienced frequent movement in and out of Morningstar's equity style categories”) prompted the firm to research how common it is for funds to move between categories. 

The whitepaper and accompanying blog post How Morningstar Category Flux Impacts Peer Group Analysis concludes, “Our research suggests that a fund's category is changed far more often than seems commonly acknowledged, and this should be a consideration when screening, evaluating, and/or monitoring portfolio performance.”

A subsequent video (not embeddable—click on the image to go view it) presented an interview with Director of Risk Management Gunjan Banati sits down with Co-Chief Investment Officer Francis Gannon.

9. After The TV Commercials, Content Comes Next

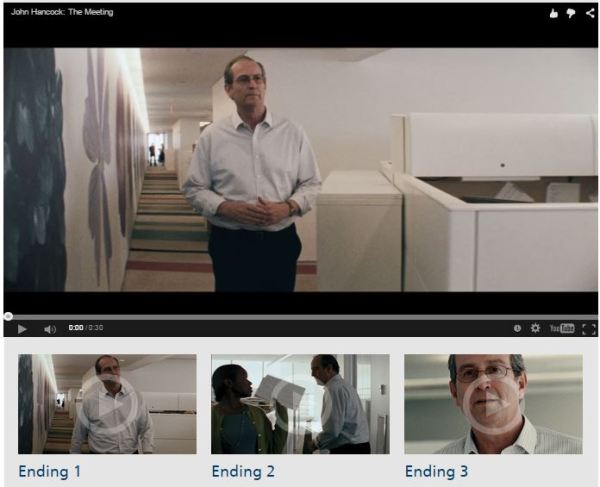
We don’t ordinarily think of advertising as content, but the John Hancock Life Comes Next series of intriguing television commercials are cross-channel. They serve as teases that lead to the microsite where three endings are offered for each, backed by related content.

Veteran advertisers like John Hancock know how to create commercials that are evocative, and these are terrific. If the overall program is succeeding in engaging viewers in the follow-up content and #lifecomesnext Twitter conversation, they’ve crossed a frontier not many have.

10. Dare To Be Different

Who says you can’t mention product in your blog posts? Lots of people have, over time. The idea is to engage with content that's a level above product.

But this isn’t a hard and fast rule for a business whose business is to manufacture products. Technology companies, for example, blog about their product innovations and updates.

There’s nothing poetic about this January Direxion Investments post but it’s straightforward in connecting forecasted trends with ways to use ETFs to play them. Why not try sales ideas as blog posts and see what happens?  

11. It Takes A Community

I liked Jay Palter’s Top 250 Financial Services Online Influencers That You Need To Know post for a few reasons:

  • Most obvious: The list itself, published in March, is a good place to start if you’re wondering who to follow on Twitter. Finserv isn’t as showy and prolific as others, and you could burn up a lot of time before finding these accounts on your own.
  • The very ability to create a list of 250 names of individuals focused on the regulated financial services industry (broader than just asset management) flies in the face of those who believe not much is happening with financial services and social media. There is a community, in fact.

Lots of smart people have seized on social media for its potential to improve information exchange and overall communication, and the focused content sharing by these Twitter accounts helps foster that.

  • Jay gives a good tutorial on how you might use Little Bird to create your own list of influencers for use in market intelligence. The exercise can help you see the value of optimizing your firm's social accounts with relevant keywords and hashtags that will help others find you.

12. The Benefit Of Looking At Your Own Data: The Sequel

One of 2013’s content highlights was TD Ameritrade’s creation of the Investor Movement Index, based on a sample of the firm’s 6 million accounts. It “raised the bar for other investment companies whose proprietary data contains insights when aggregated,” I wrote.

    It’s back in the list this year because of a Tumblr post by Nicole Sherrod, Managing Director of Trading at TD Ameritrade, published on Yahoo! Finance. Sherrod used the actual data to challenge sentiment survey results. You have to love this subhead: "Is Investor Sentiment Like the Truthiness of a Tinder Profile?"

What people tell the American Association of Individual Investors (AAII) Investor Sentiment Survey that they’re doing is one thing, Sherrod writes, and is volatile. 

But, she says, “What they actually are doing is reacting fairly consistently…Now you can see why we built this index. The IMX gives a view of reality with empirical data that shows what retail investors have actually been doing.” 

13. A Definitive Study On Social Media And Financial Advisors

At this point, financial advisors’ use of social media has been a preoccupation for several years. Early on, it was enough to know that some percentage of advisors considered social media appropriate for business.

But as interest heightens among asset managers, broker-dealers and vendors, questions about advisor participation have necessarily gotten more granular. We are well past high level issues. Given the investment that’s being made in content development, training (firm/advisor) and increasingly advertising, we need to know who’s doing what where and why.

Last week Putnam shared the first of the results of an extensive survey that reports on some issues not previously researched and digs into questions just superficially covered previously. These details could provide the insight needed to optimize your strategy.

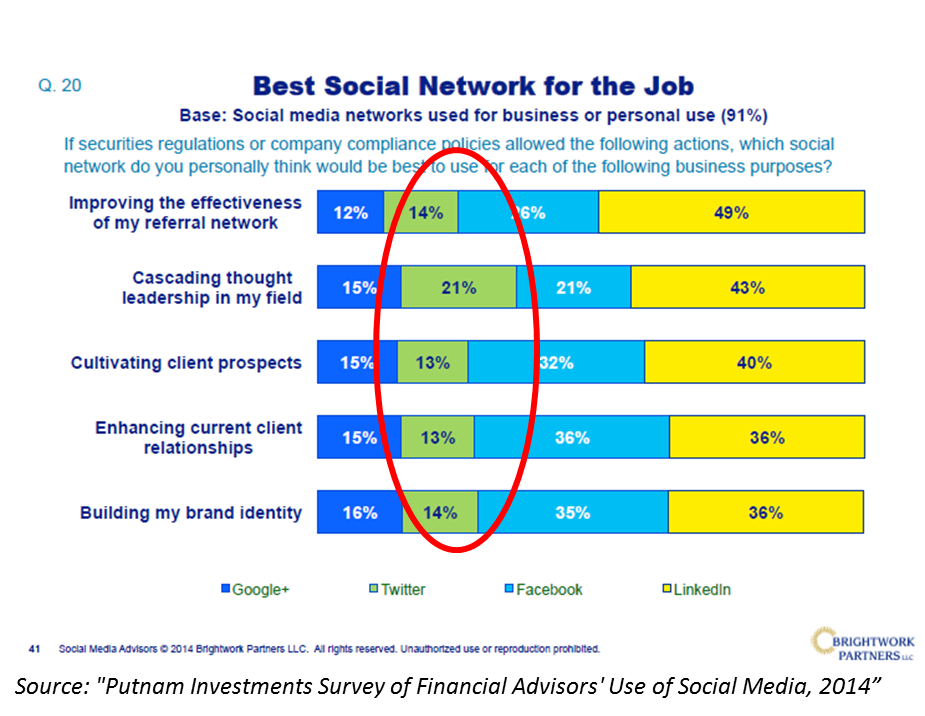
LinkedIn, for example, gets all the ink and its dominance among advisors is unquestionable. But note this finding from the full report that the highest percentage of advisors considers Twitter the best network for “cascading thought leadership.”

PutnamSocialMediaSurvey.png

There is a lot here worth your attention, given the survey’s finding that more than half (56%) of advisors now say that social media plays a “somewhat significant to very significant” role versus 35% just one year ago.

(By the way, after I tweeted some of the findings last week, a few people asked whether Putnam is a client. No, it isn’t and never has been. I was excited to see the new dataand yet no exclamation points were used.)

14. Bond Lessons As Performance Art

When you’ve got it, flaunt it.

This iShares video plays to the performance chops of fixed income strategist Matt Tucker and troupe. BONDing is a 2014 asset manager video series (just two to date) that investors will both learn something from and enjoy. My favorite moment in the video below comes at 1:40. Watch for the hand, that's just people having fun. Mutual fund and ETF videos could use more of that.

Bonus: More?

Inspired after reviewing the 2014 content that has stood the test of time? Download Synthesis Technology's Win The Investment Marketing Game, a 20-page e-book that I was pleased to participate in.

This will be the final post of 2014. My sincere thanks to all who contributed to and followed the blog this year. I wish the happiest of holidays to you and yours. Meet you back here the first week of January 2015.

22 Content Highlights To Remember From 2013

“And, the audience sprang to its feet and cheered…”

If you’re in the online content business, such physical signs of positive reinforcement are hard to come by. But, know that what you do is appreciated and often celebrated.

The following list contains 22 pieces of content. I cheered these gems when I learned about them at one point or another in 2013 and they've stood the test of as much as 12 months' time.

As in previous Rock The Boat Marketing annual content highlights (last year’s), this is an idiosyncratic compilation across multiple digital marketing subject domains. Most of these I like for their content, some for their design, their delivery or the evolution they represent. They're presented in no particular order.

Want to play along next year? Come join me on Twitter where the majority of these highlights were surfaced by the awesome information hounds I either follow or am led to. In 2013, I also explored more content on LinkedIn, Google+ and Pinterest—follow me on those networks or just check in once in a while on this site's Resources page.

1. How Google Reads Minds

The results that Google presents to you the searcher are based on how it “understands” the words you type into the search engine. You know what you want but your search query may have literal meanings that you don’t intend.

This excellent Vertical Measures graphic from April details what Google has in place to read your mind, and how that's evolving. The screenshot below is just a slice of the full infographic.

2. No Money Manager Is An Island

Part of being social is taking part in the broader community. Quite a few mutual fund and exchange-traded fund (ETF) firms seemed to acknowledge that this year with how they managed their social accounts. We saw more accounts following others, more sharing of others’ content and an occasional #FF (Follow Friday) recommendation.

No less than PIMCO’s Bill Gross acknowledged that investment and economic insight takes a village—and people showed a lot of interest in who influences this influential money manager. From August, this is one of PIMCO’s all-time most favorited tweets. It would have been too much to expect him to use the Twitter handles.

Gross: Strategists/writers I follow? Dalio, Durden, Bianco, Arnott, Aitken, Santelli, Grant, Grantham, Inker, Marks, Quaintenance & Brodsky

— PIMCO (@PIMCO) August 9, 2013

3. And We Are Doing This Why?

“…The silence around the economics of content is deafening,” says Forrester analyst Ryan Skinner in this July post 16 Ways to Turn Content Marketing into Business Value. Skinner then proceeds to break down what he names as catalysts of content marketing value: brand, next click, relationship, reach, data.

Many firms aspire to be content factories today, which is all well and good. Before you plow ahead into production, read the Skinner post to make sure you’re aligning what you’re doing with what drives value.

4. While You're At It, Throw In Some Sincerity, Too

It’s a good idea to present yourself as authentic and transparent. But, um, as this Tom Fishburne cartoon from June suggests, you may need to bring that in-house.

5. DIY Dashboard Help

Marketers need to be more analytical. That drumbeat got louder and louder as the year progressed. If you’ve ever found yourself looking for Excel training applied for marketers online, you may be happy to learn about this Excel dashboard series. Written by Annie Cushing and augmented by a video or two, it started in June on Search Engine Land and then continued on Marketing Land

6. Showing Signs Of Life On Google+

This November update isn’t on the list because the content is break-out. It’s a little more Facebook-y than I like for Google+.

But it’s an example of how the largest mutual fund company is not just experimenting but succeeding (relatively speaking) in engaging people on a social network that most investment companies have decided to ignore.

More than 700,000 people have circled the Vanguard account, 22 people +1ed this post, three shared it and 13 commented. And, what other social network (i.e., somebody else’s platform) provides such open real estate (no ads) for your message and yours alone?

7. A Map Can Show You Where You Need To Go

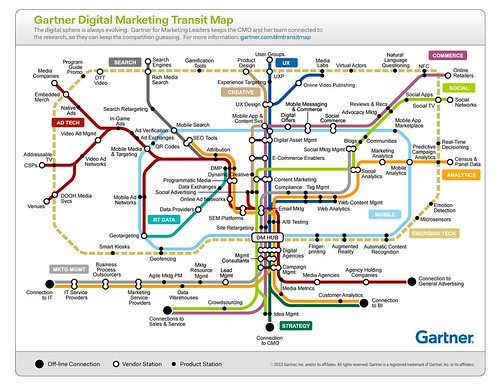
Infographics were so 2010. Still, I couldn’t resist spending several minutes of my life with this Gartner Digital Marketing Transit Map released in June.

Gartner says, "Organizations should use the map to identify the connection among business functions, applications tracks and providers. Map elements can be used to find additional research or structure questions about strategy and best practices as well as providers, products and selection criteria. It is also a useful device for mediating discussions between marketing and IT."

Show this to the people in your life who think all digital marketers do is email and the Website.

Gartner Digital Marketing Transit Map

8. Right Time, Right Place

Advertising a financial advisor-only conference call? On Twitter? By Royce Funds? Yes, yes and yes. In October, Royce Funds showed its leading edge lead-generation chops by employing a Twitter card to drive sign-ups.

RoyceTwitterRegistration.JPG

9. Lovely To Learn From

Design is rarely front and center for digital marketers, and yet it's especially important at a time when so many clients and prospects access information via mobile devices. You’ll take a lot from this Prophets Agency presentation published last January—and follow the account to learn when the 2014 outlook is available.

Trends in interactive design 2013

from

Prophets Agency

10. Where Do I Sign Up?

Few of us have high expectations when we go to a conference Website. Oh sure, the highest-profile events command the resources to deliver a functional, pleasant experience, but the majority of event sites lack luster.

That’s not the case with this vibrant LPL Connect 2013 site. I’d bookmarked it during the August event (which I attended by hashtag only) and hoped it would still be reachable when I returned to it for this list.

Outstanding—not only did it not go dark after the event, it’s been updated. Why would you go to a conference site afterward? Just one reason, probably. LPL lets the presentation archive dominate the home page, while most event sites require attendees to go looking. All that’s missing from my cursory review of the site is a Search capability. 

11. Sharing The Data

TD Ameritrade knew there was value in providing insights on what its investors were thinking. Previously, according to their Website, they'd satisfied media and others’ requests for information with opinion surveys.

That approach was upgraded considerably in January with the release of a quantitative, behavior-based index that reports on what retail investors are actually doing.

The Investor Movement Index, based on a sample of the firm’s 6 million accounts, is a tool that has ongoing marketing and communications utility. It raises the bar for other investment companies whose proprietary data contains insights when aggregated.

Wouldn’t it be cool (and ostensibly instructive) to someday get a full picture of what investors and 401(k) participants are doing, via a single site driven by the sampled and anonymized data from individual brokerage and investment firms?

12. Two Pictures = 1,000 Words

Nowadays, people are relying on mobile devices to share what they see around them and especially the news. We all need to plan accordingly.

Not that you needed the previous two sentences after looking at these photos comparing people anticipating a 2005 papal announcement in St. Peter's Square, Vatican City, and those in March 2013. 

If your client or boss isn't taking mobile strategy seriously, show them this picture of the Vatican crowd: pic.twitter.com/CPlrCbwrnp

— Fike (@MichaelFeldman) March 15, 2013

13. We Were Right There With You

From Google Earth to Reddit to Twitter, the Internet was focused on April’s Boston Marathon-related bombings.

From my perspective, this is the best content that came out of it. The rest of us were worried about Bostonians. In an inevitably schmaltzy way (is there any other when Neil Diamond is involved?), this video demonstrated their resilience. 

14. The Dope On SERPs

Google’s search engine results page (SERP) changed big-time in 2013. In October Moz provided a visual guide to all the variables that could possibly appear in (mostly organic) search results and why. Study the full guide (the screenshot below is just an excerpt) but don’t bother printing it—things may have changed since you started this post.  

15. Starting With Why

Water Investing, Calvert’s iPhone/iPad app launched in November, is different from other investment manager apps in at least four ways:

  • It’s about something—the world's water crisis—as opposed to being a container of investment commentary and investment product information. The embedded video is effective at using the medium to communicate more than just words and images could.
  • Its Daily Drip is an aggregation of others’ (non-Calvert) views and updates.
  • It offers the tweets of not just the firm but three analysts using a #CalvertH20 hashtag.
  • It includes a "Play" feature that uses the device's camera to simulate a water effect. Kinda corny but something to build on.

16. A Framework For Your Work

You could land on any blog post on Avinash Kaushik’s Occam’s Razor site and find Web analytics gold. But, make a special effort to read See-Think-Do: A Content, Marketing, Measurement Business Framework. Your entire day every day can be filled in the pursuit of digital marketing tactics. This post is a nudge to be more strategic in how you think about your work and its effectiveness.

BREAKING: Sorry, I can’t let this post fly without also mentioning a December post in which Kaushik lays out a digital marketing “ladder of awesomeness.” Another must-read. You might just want to subscribe to this site.

17. Endorse Me As Father of The Bride

A chuckle is the last thing I expect when I log into LinkedIn but, no kidding, some of the photos being used for profiles are funny. This MarketingProfs 19 More Reasons Your LinkedIn Headshot May Be an Epic Fail presentation is not exaggerating. Too bad it doesn't touch on one of the types of photos I commonly see. Men in tuxedos, really?

19 Reasons Your LinkedIn Photo Is an Epic Fail

from

MarketingProfs

18. Looking Under The Hood

Last week was all about learning an hour of code. I’m guessing most of you sat that one out. But this week, how about learning to just read the source code on your Website?

If your work has anything to do with optimizing your site for search engines, this KISSmetrics post from August provides an excellent foundation for how to confirm what's happening on your site. Bonus: Check other sites' source code to learn what they're up to. This screenshot is just the first example the post provides.

19. Out Of The Ashes

First there was the dramatic reading by James Earl Jones and Malcolm McDowell of Jenna’s Facebook for a Sprint commercial. I loved that. Moving onto the digital realm, on YouTube two actors re-enacted a YouTube comment war between two One Direction fans.

But the investment industry has nothing to do with most memes. We wouldn’t do the Blurred Lines knock-off videos, twerking is out of the question, and the President of the United States took part in a selfie before an asset manager CEO has. 

So, while I suffered along with other financial services marketers when the #AskJPM Twitterchat imploded, I have to say that a subsequent CNBC video published the next day thrilled me. Stacey Keach provides the dramatic reading. 

It didn’t go anywhere (just one tweet!) but let history show that this may have been the first stab at a meme. Thanks to my buddy Todd Donat for first sending me the link to this.

Too soon? I hope not.

20. In Another's Eyes

When one Website sneezes, do the other Websites catch a cold? Nah, the failings of healthcare.gov just inspired Slate in October to show how iconic sites Facebook, Yahoo, Amazon and Windows would have made the site over in their own image and likeness. Pretty genius. 

21. Borrowing From The Journalists

The introduction of data, including visualization, can add to the usefulness of content you’re creating.

But this is yet another competency that people in marketing positions today will have to learn on the job. Most likely, you will not be crunching the numbers, you’ll be managing the data-driven work. To be an effective partner and contributor you may have to dig in.

It was prepared for journalists and not marketers, but the Data Journalism handbook may be just the resource you need. The handbook, a version of which is also available in print, is a project of the European Journalism Centre’s Data Driven Journalism initiative.  

22. Tech To Watch Out For

The Marketing Arm’s Tom Edwards, the author of this contribution to iMedia Connection, sounds like he has one cool job as an evaluator of interactive/new media and emerging tech.

We’re the beneficiaries as he outlines—and provides plenty of examples of—six marketing technology trends. Included: collaborative commerce, curation, second screen and social TV, rich social media, crowdsourcing and social and CRM. The screenshot below shows the user interface of a social TV app.

This post will do it for me for 2013. Happy Holidays to all and see you back here in the first week of 2014! 

Asset Managers Start To Say It With Pictures

“Hey, I read your ____.”

That would be the highest compliment that a family member could ever give me. After years of writing for various publications and companies, I’m still waiting to hear that a relative other than my sainted mother (she’d suffer through anything) read something that I wrote.

And yet the other day, I happened to mention something that I saw on an asset manager site to my recent college graduate niece. “Oh, I’d like to see that,” said Katy. And, the knife turned when she texted me later to remind me to send her the link.

Huh.

If you’re in the words business, as many asset management firms are, change is in the air. Signs are that the rest of the world, my family included, wants to see more than they want to read.
Read More