SPECIAL REPORT: The Effect Of The Market Meltdown On Traffic To Top Mutual Fund, ETF Web Sites
/ TweetNet outflows from equity and fixed-income funds were at record dollar levels in October, according to Lipper, Inc. How did October’s market meltdown affect traffic to mutual fund, ETF and other investment company Websites? We’ve been eager to analyze the data.
Below are charts from Compete.com, a free online service that enables the tracking of Websites by basing estimates of U.S. traffic on a triangulation of multiple data sources, including Internet service providers (ISP), panels and toolbars. (Read more about how Compete estimates traffic.) Within the analytics industry and from or experience, the data estimates are reliable and most analysts use them with confidence.
The Top 24 Fund Groups
We’ve chosen to look at traffic to the top 24 fund groups in long-term open-end funds and ETF assets as of September 2008, according to the Financial Research Corporation (FRC). Compete data is most reliable for 19 of the companies, which have at least 40,000 monthly visits. Compete qualifies the data for asset managers with less than that as “rough estimates.”
These comparisons can be considered no more than directional, for the following reasons:
- We chose to look only at the brand domains. Many of the larger and even some of the small sites use domains not represented in the data. For example, Columbia Management traffic is dispersed across at least three domains: ColumbiaManagement.com for its financial advisor site, ColumbiaFunds.com for its investor site and YoungInvestor.com for younger investors. We show data for ColumbiaFunds.com because it’s the most visited site of the three but realize that it’s not a direct comparison to other site reports, whose traffic includes all audiences.
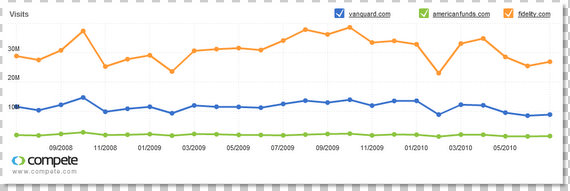
- We looked at the top 24 in order of their AUM, according to FRC. The 24 include five companies that distribute directly to investors and could be expected to produce more traffic. Four companies are institutional and likely to have less relative traffic. We graphed the 24 in sets of three, which produced readable charts in most cases. Two exceptions are State Street Global Advisors and Dimensional Fund Advisors whose site traffic doesn’t appear to be in sync with same-size managers. Third in AUM, Fidelity.com is different from the others—much of its estimated 33 million visits in October have to be attributed to its transaction functionality.
- Traffic is a measure of heightened awareness, and we’ve compiled this to answer a single question: In a month when global markets were gyrating in a way that had rarely if ever been seen before, did people seek out asset manager sites? The path to redemptions is never exclusively via a Website; we suspect redemptions predominantly took place by phone, whether via a call to an advisor or to an Investor Services number. The Compete graphs of site visits answer the question but can shed no light on the next logical questions: Who was visiting—new or repeat visitors? Financial advisors, the press, shareholders? Where did the traffic go—straight to the online access to check accounts? To read investment or product commentary?
Of course, executive and marketing management can get real, deep and even actionable data about what happened on their domains in October (and what’s going on now) from their own installed Web analytics.
Fidelity, American Funds, Vanguard Site Traffic

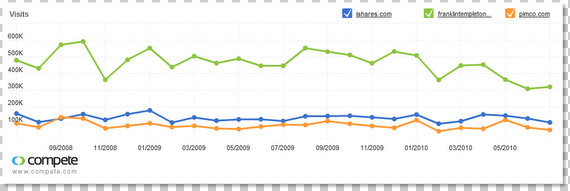
iShares, Franklin Templeton, PIMCO Site Traffic

T Rowe Price, Oppenheimer Funds, SSGA Site Traffic

Dodge & Cox, Columbia, Legg Mason Site Traffic

Black Rock, Dimensional, Janus Site Traffic

Alliance Bernstein, JP MorganFunds, MFS Site Traffic

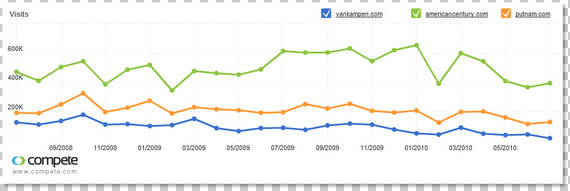
Van Kampen, American Century, Putnam Site Traffic

GMO, Davis Selected, SEIC Site Traffic

What’s the takeaway from these graphs?
- Traffic was up almost across the board in October. Most significantly, traffic for the big three (Vanguard, American Funds and Fidelity) was up a minimum of 15% over September. This is substantial given that their sites attract multimillions a month.
- But, overall the site traffic wasn’t off the charts. Excepting Fidelity, steeper moves can be seen in August/September. A few companies experienced higher traffic earlier in the 12-month period.
- Pimco was one of two companies whose site traffic, while up big for the year, was down in October. According to FRC, Pimco is one of only two (Ivy Funds being the second) in the top 50 fund groups with assets up, year to date and year-over-year. Traffic to Dimensional Fund Advisors also was down in October and for the year.
- Companies whose traffic for the year (but not October) is down: Van Kampen, American Century and Janus.
What Are Investors Looking For?
How does Marketing react to a spike in traffic that Marketing itself did not produce? Of course, you’d be pleased if traffic climbed in response to a promotion. But can you be neutral (or let’s hope not—uninformed) about high site traffic that external events generated? Your audience thought about your company--using high site traffic as a proxy--much more in the last few months. Shareholder/investment redemptions speak volumes but they don’t communicate everything. What are investors looking for? How deliberate are you in helping them connect with what you understand them to be seeking? Some investments don’t make sense right now, but others are “saleable.” And yet, many sites continue to present all products equally as if all were equal in terms of their current appeal. It is easier to sell straw hats in the summer.
Now while advisors and investors continue to seek information and going forward as the markets recover, you have an opportunity to tune your site to guide your audience to the best of what you have to offer. Experts in shifting investor preferences expect that marketers with ETF providers may have an advantage and marketers from mutual fund companies may have a disadvantage. Still, your rebuilding will be quicker and more relevant if you find a way to marry heightened site traffic, your understanding of what investors/advisors are looking for on your site and appealing, appropriate products.


