Heartbleed Bug: The Less Said, The Better?

I want to tread carefully on this. Online account security is nothing to trifle with. In all likelihood, concern over the Heartbleed security bug has seized the attention of the very highest levels of your mutual fund or exchange-traded fund (ETF) organization.

The timeliness, frequency and depth of what your firm communicates about your own and third parties’ systems’ status, including vulnerabilities and patches, is a function of your culture and of your executive management including your IT, Legal and Communications leadership.

Understood. At the same time, I’m guessing that your Sales and telephone staffs have been armed with scripts for institutional investors, financial advisors and individual investors since the hole in Internet security was revealed in late March/early April. The relationship managers who serve those constituencies no doubt demanded “something to tell them,” and they’ve received what they asked for.

Why haven’t more communications appeared on Websites and in social media account updates? Two weeks after the initial report, I’ve seen just a handful of communications. Not all are on Website home pages, and even fewer have been part of the Twitter or Facebook update streams. 

The media has been continuously warning people to change the passwords on their financial accounts and other accounts where they may have used passwords also used on financial accounts.

Two-thirds of all Websites are reportedly affected. Among fund companies specifically, no less than American Funds has disclosed that it had an issue.

In the screenshot below, you’ll see that one person asked about Heartbleed in an April 10 comment on an American Funds' Facebook update about something else. And, you’ll see the April 14 note that American Funds posted on its Website acknowledging a “very narrow of risk.” According to reports yesterday, American has emailed clients suggesting that they change their user information, password, security image and questions, and delete their browsing history and cookies.

This is unfortunate and, American Funds was obliged to communicate the risk to its clients.

If your firm hasn't already fielded calls about Heartbleed, American Funds' notification to its 800,000 mutual fund shareholders and their advisors likely will heighten concern and result in questions.

At times we've all wondered, “What do our clients really want from us?” In this instance, isn’t it predictable? Isn’t it logical to expect that clients arrived at mutual fund and ETF Websites or checked Twitter feeds looking for Heartbleed information?

Even if your firm's systems have not been compromised. Even if you don't operate a brokerage business. Even if your firm uses a third-party transfer agent for shareholder servicing and all your site does is provide a link to that site. Even if IT scoffs at the question whether the passwords to your advisor Website could have been hacked.

Your client is not likely to be making these distinctions. 

'Controlling The Message'

At one time, brands sought to control the size of the attention given to an issue by limiting what they said. That’s not available anymore, if it ever was. And, there's the false security in believing that an offline communication can remain under the radar just because it isn’t made available on the Web.

In delivering the self-publishing capabilities that enable individuals to share brands’ marketing news, Web 2.0 has also empowered individuals to share a full range of information with each other. In this space, we know that financial advisors tweet advisor-only conference calls and upload to their blogs images from restricted distribution publications, for instance. Shareholders regularly complain about firms' password protocols on Twitter.

On the subject of Heartbleed, citizen contributors to both Bogleheads.org and a Morningstar forum took it upon themselves to check some fund Websites on a Heartbleed hacker checker. One result, according to the posters’ claims, was that TIAA-CREF failed the test of its site. See this and this. In fact, according to a syndicated press release that appears on this Web page, TIAA-CREF at one point issued a statement denying online reports of Heartbleed vulnerability.

Like it or not, there is no such thing as keeping something quiet or controlling who or what is going to pass a communication or even an observation on. There is no flushing search engine results.

In your organization, nobody knows this better than Digital Marketing. Even when there’s nothing to report, say something because your clients want to hear from you and you know that the Website or your Twitter or Facebook page is where they’ll come to. A clear, adequate communication on the Web will keep the call volume under control, and will facilitate the peer-to-peer online communication already underway.

Marginalizing A Digital Presence

Less important for your clients but important to the contribution your work can make: A de facto policy that reserves Web and social communications for only what’s required (fund updates) or marketing-based (commentaries, appearances, announcements) marginalizes the potential value of having an open, 24/7 digital presence.

Every once in a while I hear from someone who asks why I haven’t adopted the term “social business” instead of “social media”—the implication being that brands have evolved beyond social media. I disagree. The pages of the calendar may have flipped, but this has yet to become a social business.  

Four years ago, I was surprised when more financial Twitter accounts didn’t use their Twitter accounts to communicate about the flash crash. But that was too early in the history of asset managers and social media, the news itself was confusing, firms weren’t ready.

Little more than a year ago, PBS ran a documentary about retirement funding and the expense of retirement plans. Most asset managers chose not to comment, despite the fact that the show consumed online commentary for a while. It was controversial and complex, and no firm was compelled to jump in the fray.

This slower developing Heartbleed issue, on which few fund firms were directly impacted apparently, was an opportunity for a firm to demonstrate the attributes of being social—transparency, accountability and authenticity among them.

The relevant, financial services-focused online conversation these last two weeks has been about Heartbleed and the security of financial assets. Others have had plenty to contribute, and more firms could have joined in, even if only in an informational/educational (change your passwords!) role.

It's strange to land on a financial site with no front-and-center acknowledgment of Heartbleed. Forgive me. But even to someone who knows better, the firm seems out of touch, at best.   

The topic is too hot right now for you the digital marketer to call the question internally and advocate for your “constituency.” But if you agree that it’s time to challenge those who believe “the less publicly said, the better,” you might start to think about what it will take to get your firm to think more expansively.   

To help you make your case, here are a few examples of firms that have communicated something. 

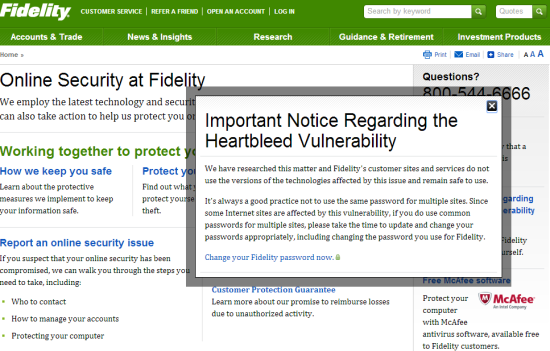
Fidelity Pop-up

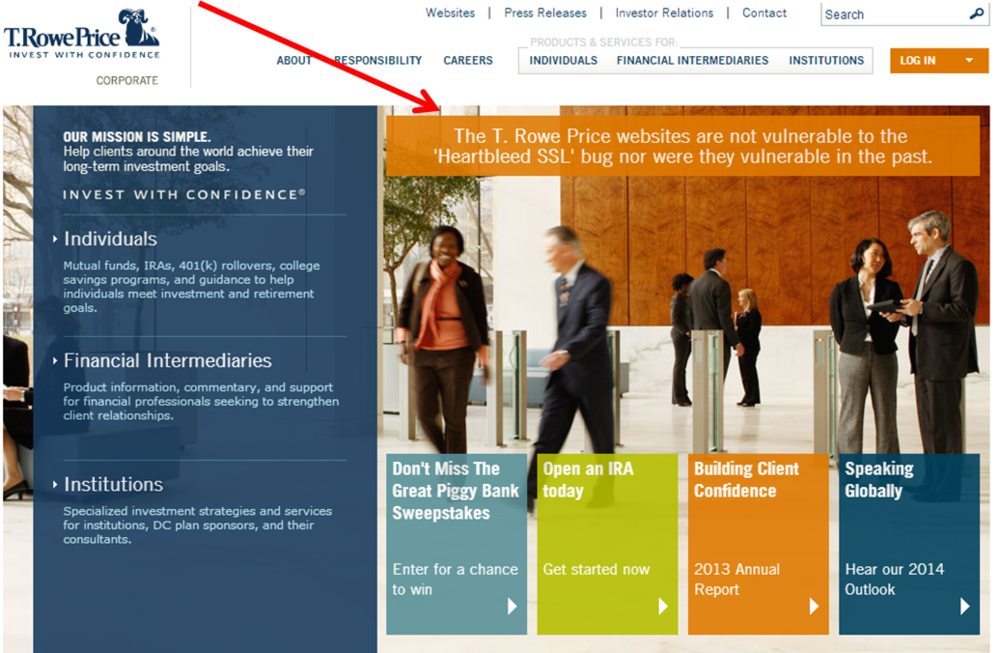
T. Rowe Price Splash Page Violator

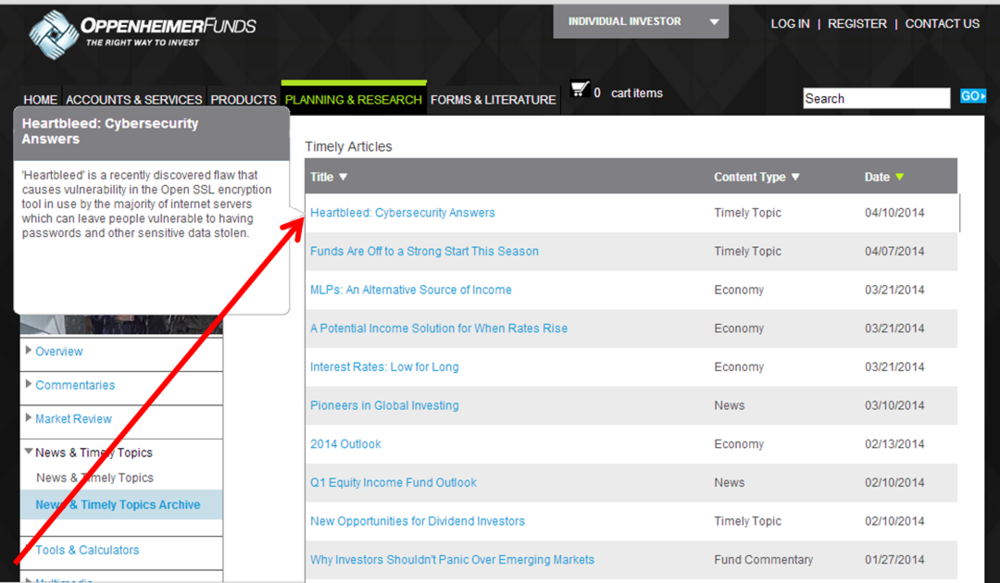
OppenheimerFunds Timely Topic

Vanguard Home Page News Item

Compare Your KPIs To The Best In Financial Services

The “financial services” industry is a big ole bucket. 

But given the other industry possibilities (Retail? Media? Technology?), investment firms have more in common with banks, credit card, insurance and brokerage companies. If you’re a mutual fund or exchange-traded fund (ETF) marketer looking for data to measure your firm’s digital performance against, you could do worse than look at “financial services” benchmarks.

Smartphone, Tablet, Website Benchmarks

Specifically, Adobe this week published some benchmark data you might find useful. The Adobe Digital Index “Best Of The Best Benchmark” report is based on 210 billion visits in 2013 to 11,000 mostly large enterprise Websites that are customers of Adobe Analytics. The review set included “a few thousand financial services companies. We don’t break out our samples to any level beyond financial services,” according to Tamara Gaffney, principal analyst, Digital Index.

Adobe reported on the performance of financial services and four other industries (retail, travel and hospitality, high-tech, and media and entertainment) on five key performance indicators (KPIs): 

  • Share of smartphone visits
  • Share of tablet visits
  • “Stick rate” (the percentage of visits that include more than one page)
  • Pages per visit
  • Minutes per visit 

Conversion rate benchmarks are provided for some industries but not for financial services because, Adobe says, “financial organizations all have a different concept of a conversion." This makes it difficult to standardize for.

The data show that there’s a fairly large gap between the performance of the “best of the best”—the top quintile in each industry—and everybody else, aka “the masses.”

“The results of [the research] make it clear that organizations that invest in people, processes, and technology are reaping the benefits” is Adobe’s high-level conclusion.

Where Finserv Outperforms

The report provides an opportunity to see how financial services does relative to other industries and where the top 20% of financial services organizations are outperforming their peers.

You’ll want to download the full report for all the insights and data. Below are a few tables I created to isolate financial services. Just call me Parochial Pat. (No, please don’t.)

In the table above, you’ll see that the best financial services organizations lead other industries in stick rate. Almost eight out of 10 visits to the top quintile financial services sites included visits to more than one page. That’s impressive, according to Gaffney.

“Stick rate is very complicated because there are two factors that drive visitors deeper into a site. First, they must be the right visitor so visitor acquisition targeting needs to be optimized. That requires careful targeting as well as testing multiple approaches to discover which ones provide the best visitors.

“But then,” she says, “those visitors need to land on a page (sometimes from their phone or tablet) that works, is what they expected and has a clear next step. So content, responsive design, personalization and clear paths forward have to be in place.”

Bravo, take a bow!

Unfortunately, the best in this industry trail all other industries in percentage share of tablet visits, and all but high-tech’s best in percentage share of smartphone visits. 

But above see how finserv comes roaring back in the visits measures—the best financial services sites have the highest number of pages per visit, and trail only media and entertainment and high-tech sites in minutes per visit.

This data suggests that the best of financial services have some significant digital chops. Oh and here’s a look at the year-over-year improvement. Note the big gain in share of smartphone visits.

For your benchmarking, the table below may be the most useful. Above-average performance on these dimensions would be between the range set by the best in the industry and the average. 

Wide gaps between the best and the average suggest that the best are pulling away from the competition, which is Adobe’s point in publishing the research. Of course, you'd have a better sense of your relative performance if the research was provided for the asset management subsector.

Take a look at your analytics and see where you stand. Thoughts? Please comment below.  

How About Streaming Your Podcasts?

Here’s a friendly reminder that content syndication requires continual monitoring. Opportunities that once seemed bright can dim overtime while new directions are constantly emerging.

podcast.jpg

A case in point: If you’re an investment firm that offers podcasts to be downloaded, consider making them available to also be streamed. Streaming video (e.g., Netflix) and streaming music (e.g., Pandora) get most of the attention, but faster Internet connections and wider bandwidths have also changed the access habits of podcast listeners.

The ability to forego the downloading and syncing process with a media player in favor of streaming a podcast on-demand significantly improves the podcast listening experience. I can tell you from my own experience that not having to plan ahead has resulted in my listening to even more podcasts, from more devices (desktop, iPad and smartphone) and more faithfully. I am crazy for podcasts. (And if it's data you want, see this TopRank blog post from earlier in the week.)

Stitcher!

As long as you’re going to the trouble to create podcast content, making the podcast available on a streaming service could make an incremental contribution to your listenership.

Stitcher is believed to be “the largest platform for listening on Android and second largest on iOS behind only Apple [iTunes]," according to Libysn, the leading podcast hosting platform quoted in a Stitcher press release in October 2013.

In fact, a look at the top show in Stitcher’s Business and Industry category suggests that Stitcher has listeners who may be interested in what you have to say. Note that NPR’s Planet Money podcast is on 101,000 playlists. Something to strive for.

Many of the leading investment-type podcasts on iTunes can be found on Stitcher, but few investment company podcasts are.

An exception I found is Wells Fargo Advantage Funds' "On The Trading Desk" podcast whose screenshot from an Android phone is to the right.

Like on iTunes, if your podcast isn’t in Stitcher’s top 100, most of the optimization and promotion is up to you. However, see the Discover tab in the screenshot—here’s where a listener to the Wells Fargo podcast might be introduced to yours. As is, the referrals today are to The Dave Ramsey Show, the Suze Orman Show and other media properties.

Next

If I were you, I would:

  • Make sure all internally are OK with the idea. Previously, some podcasters have balked at the thought that advertising would be displayed adjacent to their podcasts (see the ad at the bottom of the Wells Fargo image). There's no question that Stitcher has more of a commercial feel than downloading a file via iTunes. But, is this any different from posting content to Facebook or LinkedIn, which also place ads near your content? 

  • Review the application process to be accepted as a Stitcher content provider, it’s not much of a hurdle. 

  • Blow the dust off all that “download and add to your MP3 player” language on your Website and update it with the explanation that your content can be streamed and added to playlists, too. That will mean that you or someone on your team will have to experience Stitcher in order to write the copy. My bet is you’ll love it.

  • Throw a little promotional support behind your podcast when you get the word that your content has been added to Stitcher.

In the investment management space, podcasting has a tired vibe. But elsewhere Internet radio has taken off, and with the demographics that investment firms seek. Below is a screenshot from "The New Mainstream 2013," a study of Internet radio usage and adoption conducted by Edison Research, in partnership with Pandora, Spotify and TuneIn. And, even more on-point, Stitcher says the average podcast listener stays connected for an average of 22 minutes. Wouldn't you want in on that?

Fun With Mutual Fund, ETF Website Traffic Data

The next time you have an hour or two—sooner if you just can’t resist—check out the mutual fund and exchange-traded fund (ETF) sites in the investing and financial management categories of SimilarWeb.com, which reports on Website traffic. There’s a free version, which will keep you more than occupied, and a few paid subscription levels.

The individual profiles help with competitive intel about traffic levels and traffic sources, including search and social (organic and paid). Taken in aggregate, they provide a fascinating perspective on how sites are networked on the Web. Also, it’s motivating, isn’t it, to think of all of these investors in search of information?

About The Data

Like Comscore and Nielsen, among others, the data that SimilarWeb reports is based on panels of participants. SimilarWeb claims to be “several times bigger than traditional panels. This allows us to learn about every Website, big and small, and overcome the statistical errors that are typical of smaller panels.”

However, SimilarWeb’s data is of desktop traffic exclusively, and therefore not comprehensive. Mobile visits are an increasingly significant chunk of asset manager site traffic.

If you use just the free access of SimilarWeb, take note that sub-domains of Websites are reported individually. Because many asset managers rely on multiple sub-domains or maintain separate domains, the rankings will under-report the effectiveness of a competitor online. And, it can be tricky to assess traffic out of context.

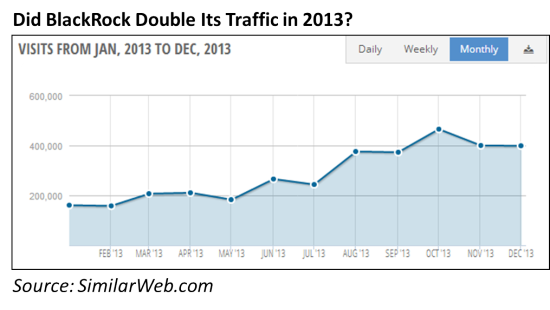
For example, BlackRock.com looks to have doubled its traffic in 2013. Is that the result of a very good year or is there another explanation—e.g., a consolidation of domains, for example?

The paid version of SimilarWeb allows for the selection of either All domains and Main domain. In the comparisons I cite below, I looked at All domains.

There seems to be a lot of movement in the top 100 rankings. I reviewed the data as of November 30 and as of December 31, and the composition of the list changed more than just a few positions.

Here’s a random list of what I found interesting about traffic to investing sites in general and to the industry’s most-trafficked sites. I’ve restricted myself to quoting only data that can be viewed for free on the site.

The More Things Change, The More They Stay The Same

First, how about some respect for the granddaddy and still number 1 among investing Websites: YahooFinance.com?

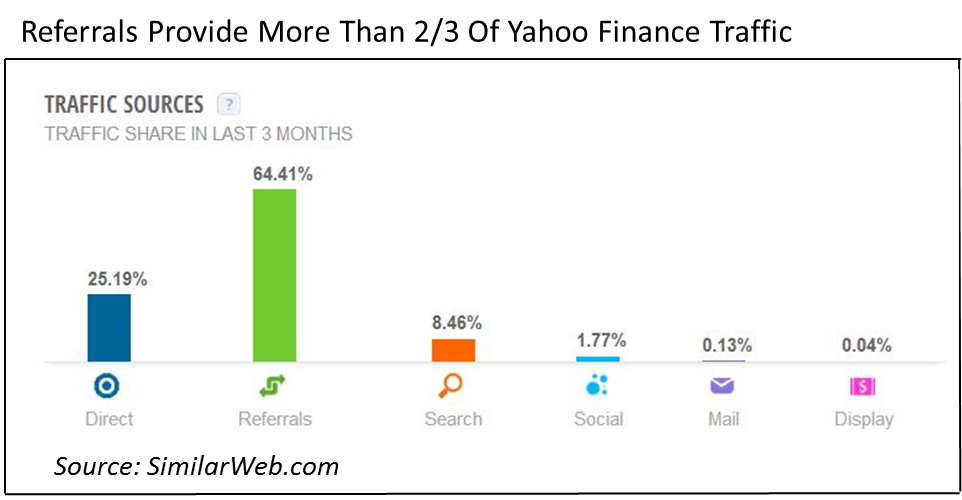
SimilarWeb says the site attracted almost 2 billion visits in 2013, 150 million in December alone. Yahoo Finance stays on top the old-school way—63% of its traffic comes from links from other sites, towering over search, social or even direct as a traffic source.

No asset management site whose data I reviewed comes anywhere close to that, and yet referrals can be an enduring source of traffic.

The New And The Odd

Quite a few new and new business-model sites have broken into SimilarWeb’s top 100 in the U.S. investing category. For example, Twitter skeptics, note that StockTwits ranked #15 in December. Two-year-old Wealthfront, “the largest and fastest-growing SEC-registered, software-based financial advisor,” breaks in at #94 on the list.

Does anyone else find it odd that of all the possible investing sites out there (including yours) FINRA.org comes in at #42? CFAs make CFAInstitute.org crazy popular (#63).

2013 Traffic Stable Or Climbing

The syndication of content and the popularity of social platforms together call the question: What's the future of corporate domains? When I last wrote about this topic in 2009, I cited asset management Website data that pointed to declining usage and traffic.

But the 2013 12-month view of traffic—visits and not visitors—available from SimilarWeb suggests that traffic to most sites has been stable, if not climbing.

Fidelity And Vanguard

Traffic to Vanguard.com ranks it as the first mutual fund/ETF site in the U.S. investing category—separated by about 2 million visits from TRowePrice.com, the next highest mutual fund/ETF site on the list.

Fidelity’s nearly 16 million visits trump all, but is categorized in SimilarWeb’s “financial management” category.

Winning Search Traffic

It appears that even the best trafficked sites could do much better at winning search traffic. This is lamentable given all the content available on asset management sites (and tons in the making). Most sites fail to significantly benefit from search results for search terms other than derivatives of their brand names.

Here’s an exception worth noting: In 2013 about 4% of Fidelity’s enormous traffic came from the search term: 401k. Impressive—and, of course, it helps that 401k.com redirects to a Fidelity domain.

Also, a few ETF providers are gaining hearty traffic from searches of their ticker symbols, albeit another form of branded search. Promoting their longer ticker symbols is something mutual funds have not tended to do.

A Few Social Surprises

Speaking from experience, one could lose oneself in the detail that SimilarWeb provides about social traffic.

The paid version reports the total number of socially sourced visits for the year and by that measure, Vanguard was the most effective social asset manager in 2013. But BlackRock came on strong in the fourth quarter. As can be seen reported on the free SimilarWeb, 12% of BlackRock’s estimated 400,000 monthly visits is 50,000 visits. From Social alone.

There are a few surprises in the composition of the social traffic. For BlackRock, YouTube was the major contributor. For Fidelity, it was Facebook.

But Vanguard’s top social driver was Reddit aka "the front page of the Internet." Reddit has been a strong source of traffic to more consumer-type sites (although reportedly less so in 2013 than in 2012). Vanguard, and Fidelity to a lesser extent, got a sizable amount of referrals from the platform in 2013. Reddit traffic drove visits to PIMCO, iShares, even American Funds last year.

What SimilarWeb can't tell us is the quality of the traffic or how successful the firms were in converting it.  

What about Twitter and LinkedIn? According to the SimilarWeb data, Twitter is driving more traffic than LinkedIn but both are just runner-ups.

Here’s a kick: Yahoo Bookmarks drove more traffic to the asset managers in the top 100 list than LinkedIn. It's a good reminder that investors and others are using all manner of new and old tools to keep track of what's happening on your site.

Have fun checking all this out.

Note: Yesterday RIABiz named this blog one of the top 10 blogs (#9) in the advisory community. It’s a thrill to be included in such a prominent set of commentators, and it makes me want to try harder to deserve the honor. I recommend the full list of blogs—which also includes the 10 bloggers’ recommended blogs—to you.   

22 Content Highlights To Remember From 2013

“And, the audience sprang to its feet and cheered…”

If you’re in the online content business, such physical signs of positive reinforcement are hard to come by. But, know that what you do is appreciated and often celebrated.

The following list contains 22 pieces of content. I cheered these gems when I learned about them at one point or another in 2013 and they've stood the test of as much as 12 months' time.

As in previous Rock The Boat Marketing annual content highlights (last year’s), this is an idiosyncratic compilation across multiple digital marketing subject domains. Most of these I like for their content, some for their design, their delivery or the evolution they represent. They're presented in no particular order.

Want to play along next year? Come join me on Twitter where the majority of these highlights were surfaced by the awesome information hounds I either follow or am led to. In 2013, I also explored more content on LinkedIn, Google+ and Pinterest—follow me on those networks or just check in once in a while on this site's Resources page.

1. How Google Reads Minds

The results that Google presents to you the searcher are based on how it “understands” the words you type into the search engine. You know what you want but your search query may have literal meanings that you don’t intend.

This excellent Vertical Measures graphic from April details what Google has in place to read your mind, and how that's evolving. The screenshot below is just a slice of the full infographic.

2. No Money Manager Is An Island

Part of being social is taking part in the broader community. Quite a few mutual fund and exchange-traded fund (ETF) firms seemed to acknowledge that this year with how they managed their social accounts. We saw more accounts following others, more sharing of others’ content and an occasional #FF (Follow Friday) recommendation.

No less than PIMCO’s Bill Gross acknowledged that investment and economic insight takes a village—and people showed a lot of interest in who influences this influential money manager. From August, this is one of PIMCO’s all-time most favorited tweets. It would have been too much to expect him to use the Twitter handles.

Gross: Strategists/writers I follow? Dalio, Durden, Bianco, Arnott, Aitken, Santelli, Grant, Grantham, Inker, Marks, Quaintenance & Brodsky

— PIMCO (@PIMCO) August 9, 2013

3. And We Are Doing This Why?

“…The silence around the economics of content is deafening,” says Forrester analyst Ryan Skinner in this July post 16 Ways to Turn Content Marketing into Business Value. Skinner then proceeds to break down what he names as catalysts of content marketing value: brand, next click, relationship, reach, data.

Many firms aspire to be content factories today, which is all well and good. Before you plow ahead into production, read the Skinner post to make sure you’re aligning what you’re doing with what drives value.

4. While You're At It, Throw In Some Sincerity, Too

It’s a good idea to present yourself as authentic and transparent. But, um, as this Tom Fishburne cartoon from June suggests, you may need to bring that in-house.

5. DIY Dashboard Help

Marketers need to be more analytical. That drumbeat got louder and louder as the year progressed. If you’ve ever found yourself looking for Excel training applied for marketers online, you may be happy to learn about this Excel dashboard series. Written by Annie Cushing and augmented by a video or two, it started in June on Search Engine Land and then continued on Marketing Land

6. Showing Signs Of Life On Google+

This November update isn’t on the list because the content is break-out. It’s a little more Facebook-y than I like for Google+.

But it’s an example of how the largest mutual fund company is not just experimenting but succeeding (relatively speaking) in engaging people on a social network that most investment companies have decided to ignore.

More than 700,000 people have circled the Vanguard account, 22 people +1ed this post, three shared it and 13 commented. And, what other social network (i.e., somebody else’s platform) provides such open real estate (no ads) for your message and yours alone?

7. A Map Can Show You Where You Need To Go

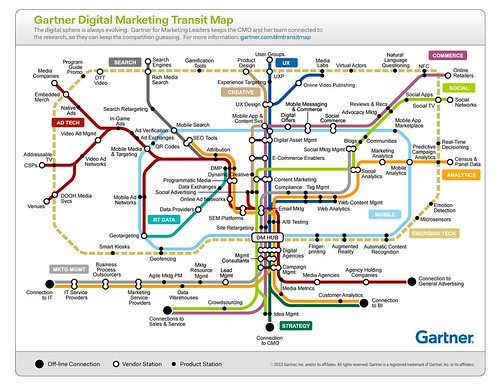
Infographics were so 2010. Still, I couldn’t resist spending several minutes of my life with this Gartner Digital Marketing Transit Map released in June.

Gartner says, "Organizations should use the map to identify the connection among business functions, applications tracks and providers. Map elements can be used to find additional research or structure questions about strategy and best practices as well as providers, products and selection criteria. It is also a useful device for mediating discussions between marketing and IT."

Show this to the people in your life who think all digital marketers do is email and the Website.

Gartner Digital Marketing Transit Map

8. Right Time, Right Place

Advertising a financial advisor-only conference call? On Twitter? By Royce Funds? Yes, yes and yes. In October, Royce Funds showed its leading edge lead-generation chops by employing a Twitter card to drive sign-ups.

RoyceTwitterRegistration.JPG

9. Lovely To Learn From

Design is rarely front and center for digital marketers, and yet it's especially important at a time when so many clients and prospects access information via mobile devices. You’ll take a lot from this Prophets Agency presentation published last January—and follow the account to learn when the 2014 outlook is available.

Trends in interactive design 2013

from

Prophets Agency

10. Where Do I Sign Up?

Few of us have high expectations when we go to a conference Website. Oh sure, the highest-profile events command the resources to deliver a functional, pleasant experience, but the majority of event sites lack luster.

That’s not the case with this vibrant LPL Connect 2013 site. I’d bookmarked it during the August event (which I attended by hashtag only) and hoped it would still be reachable when I returned to it for this list.

Outstanding—not only did it not go dark after the event, it’s been updated. Why would you go to a conference site afterward? Just one reason, probably. LPL lets the presentation archive dominate the home page, while most event sites require attendees to go looking. All that’s missing from my cursory review of the site is a Search capability. 

11. Sharing The Data

TD Ameritrade knew there was value in providing insights on what its investors were thinking. Previously, according to their Website, they'd satisfied media and others’ requests for information with opinion surveys.

That approach was upgraded considerably in January with the release of a quantitative, behavior-based index that reports on what retail investors are actually doing.

The Investor Movement Index, based on a sample of the firm’s 6 million accounts, is a tool that has ongoing marketing and communications utility. It raises the bar for other investment companies whose proprietary data contains insights when aggregated.

Wouldn’t it be cool (and ostensibly instructive) to someday get a full picture of what investors and 401(k) participants are doing, via a single site driven by the sampled and anonymized data from individual brokerage and investment firms?

12. Two Pictures = 1,000 Words

Nowadays, people are relying on mobile devices to share what they see around them and especially the news. We all need to plan accordingly.

Not that you needed the previous two sentences after looking at these photos comparing people anticipating a 2005 papal announcement in St. Peter's Square, Vatican City, and those in March 2013. 

If your client or boss isn't taking mobile strategy seriously, show them this picture of the Vatican crowd: pic.twitter.com/CPlrCbwrnp

— Fike (@MichaelFeldman) March 15, 2013

13. We Were Right There With You

From Google Earth to Reddit to Twitter, the Internet was focused on April’s Boston Marathon-related bombings.

From my perspective, this is the best content that came out of it. The rest of us were worried about Bostonians. In an inevitably schmaltzy way (is there any other when Neil Diamond is involved?), this video demonstrated their resilience. 

14. The Dope On SERPs

Google’s search engine results page (SERP) changed big-time in 2013. In October Moz provided a visual guide to all the variables that could possibly appear in (mostly organic) search results and why. Study the full guide (the screenshot below is just an excerpt) but don’t bother printing it—things may have changed since you started this post.  

15. Starting With Why

Water Investing, Calvert’s iPhone/iPad app launched in November, is different from other investment manager apps in at least four ways:

  • It’s about something—the world's water crisis—as opposed to being a container of investment commentary and investment product information. The embedded video is effective at using the medium to communicate more than just words and images could.
  • Its Daily Drip is an aggregation of others’ (non-Calvert) views and updates.
  • It offers the tweets of not just the firm but three analysts using a #CalvertH20 hashtag.
  • It includes a "Play" feature that uses the device's camera to simulate a water effect. Kinda corny but something to build on.

16. A Framework For Your Work

You could land on any blog post on Avinash Kaushik’s Occam’s Razor site and find Web analytics gold. But, make a special effort to read See-Think-Do: A Content, Marketing, Measurement Business Framework. Your entire day every day can be filled in the pursuit of digital marketing tactics. This post is a nudge to be more strategic in how you think about your work and its effectiveness.

BREAKING: Sorry, I can’t let this post fly without also mentioning a December post in which Kaushik lays out a digital marketing “ladder of awesomeness.” Another must-read. You might just want to subscribe to this site.

17. Endorse Me As Father of The Bride

A chuckle is the last thing I expect when I log into LinkedIn but, no kidding, some of the photos being used for profiles are funny. This MarketingProfs 19 More Reasons Your LinkedIn Headshot May Be an Epic Fail presentation is not exaggerating. Too bad it doesn't touch on one of the types of photos I commonly see. Men in tuxedos, really?

19 Reasons Your LinkedIn Photo Is an Epic Fail

from

MarketingProfs

18. Looking Under The Hood

Last week was all about learning an hour of code. I’m guessing most of you sat that one out. But this week, how about learning to just read the source code on your Website?

If your work has anything to do with optimizing your site for search engines, this KISSmetrics post from August provides an excellent foundation for how to confirm what's happening on your site. Bonus: Check other sites' source code to learn what they're up to. This screenshot is just the first example the post provides.

19. Out Of The Ashes

First there was the dramatic reading by James Earl Jones and Malcolm McDowell of Jenna’s Facebook for a Sprint commercial. I loved that. Moving onto the digital realm, on YouTube two actors re-enacted a YouTube comment war between two One Direction fans.

But the investment industry has nothing to do with most memes. We wouldn’t do the Blurred Lines knock-off videos, twerking is out of the question, and the President of the United States took part in a selfie before an asset manager CEO has. 

So, while I suffered along with other financial services marketers when the #AskJPM Twitterchat imploded, I have to say that a subsequent CNBC video published the next day thrilled me. Stacey Keach provides the dramatic reading. 

It didn’t go anywhere (just one tweet!) but let history show that this may have been the first stab at a meme. Thanks to my buddy Todd Donat for first sending me the link to this.

Too soon? I hope not.

20. In Another's Eyes

When one Website sneezes, do the other Websites catch a cold? Nah, the failings of healthcare.gov just inspired Slate in October to show how iconic sites Facebook, Yahoo, Amazon and Windows would have made the site over in their own image and likeness. Pretty genius. 

21. Borrowing From The Journalists

The introduction of data, including visualization, can add to the usefulness of content you’re creating.

But this is yet another competency that people in marketing positions today will have to learn on the job. Most likely, you will not be crunching the numbers, you’ll be managing the data-driven work. To be an effective partner and contributor you may have to dig in.

It was prepared for journalists and not marketers, but the Data Journalism handbook may be just the resource you need. The handbook, a version of which is also available in print, is a project of the European Journalism Centre’s Data Driven Journalism initiative.  

22. Tech To Watch Out For

The Marketing Arm’s Tom Edwards, the author of this contribution to iMedia Connection, sounds like he has one cool job as an evaluator of interactive/new media and emerging tech.

We’re the beneficiaries as he outlines—and provides plenty of examples of—six marketing technology trends. Included: collaborative commerce, curation, second screen and social TV, rich social media, crowdsourcing and social and CRM. The screenshot below shows the user interface of a social TV app.

This post will do it for me for 2013. Happy Holidays to all and see you back here in the first week of 2014!