A Closer Look At LinkedIn's Bid To Help Your Sales Pros With Social Selling

Over the last few years, social network participation has yielded all kinds of data that’s been used for predicting and measuring effectiveness—and that includes on-the-job effectiveness.

Early on, we saw job postings requiring candidates to have a minimum number of Twitter followers. Some employers advertised for people with a minimum Klout score. Those requirements, meant to serve as a proxy for a job applicant’s social stature, have largely gone by the wayside. The measures themselves were proven to have little bearing on an employee’s capability, and some question the science behind influence scores. 

I bring this up now as LinkedIn stages a full-court press with its Social Selling Index (SSI) and Sales Navigator product that promises to improve sales professionals’ effectiveness. If you’re a mutual fund or exchange-traded fund (ETF) company, it’s likely someone has reached out to your Sales management. Advisory firms, even more so, are being courted.

My sense is that there’s an enthusiasm about the SSI, in conjunction with asset managers’ keen interest in building out their overall presence on LinkedIn. After seven years of thinking about social for this business, I hesitate to say anything that could conceivably take away from the benefits that accrue from a systematic embrace of social interactions. I'm all for the listening, learning and connecting that LinkedIn enables, and provides extensive educational support for.

That doesn't mean that I don't have a few questions.

LinkedIn’s approach is different from basing hiring decisions on Twitter followers or Klout scores; its tool is designed to change behavior. But it’s similar in that it makes a correlation (LinkedIn activity drives sales effectiveness) that requires a leap, particularly when it comes to wholesalers calling on financial advisors.  

A New Sales Performance Measure

LinkedIn describes SSI as “a first-of-its kind measure of your company’s adoption of social selling practices on LinkedIn.” The SSI formula was computed based on survey research conducted a few years ago and on behavioral analytics. The screenshot below from a 2014 presentation elaborates on how the formula was developed.

Social Selling Index Formula

According to LinkedIn, adoption of social selling practices has four dimensions: the creating of a personal brand, finding the right people, engaging with insights, and building strong relationships. Each of these can be measured on a 1-25 point scale for a possible high score of 100.

I should say that each can be measured by LinkedIn based on social selling activity that takes place on LinkedIn.

You and I and everyone who has a LinkedIn profile has an SSI computed by LinkedIn, according to our performance on the dimensions, also known as the four pillars of social selling. I heard this at a Webinar I sat in on this week.

However, it’s not so easy to learn what your SSI is. Evidently, attendees to the Sales Connect conference last year were delighted to be welcomed with posters showing their scores, and I’ve seen a few LinkedIn Webinars that reported the SSI distribution of the Webinar attendees.

Otherwise, I think you need to talk to a sales rep. Also, the LinkedIn page where you can submit a request to get your SSI has an asterisked note that the SSI is for companies with over 100 employees and 10 sales reps, which should not be a hurdle for most of you.

This 2:30 video is a succinct explanation of SSI, starting with some data that shares what LinkedIn has learned from tracking its SSI over the last few years. Those with a high SSI score were promoted 17 months faster. SSI leaders have more opportunities per quarter and are more likely than SSI laggards to hit quotas.

It's Genius!

From April 2012 to July 2014, according to LinkedIn, the average SSI performance increased 87%—which LinkedIn attributes to increased participation in its four pillars. There was an average 26% increase in SSI by Sales Navigator customers within three months of their activation, according to the 2014 presentation.

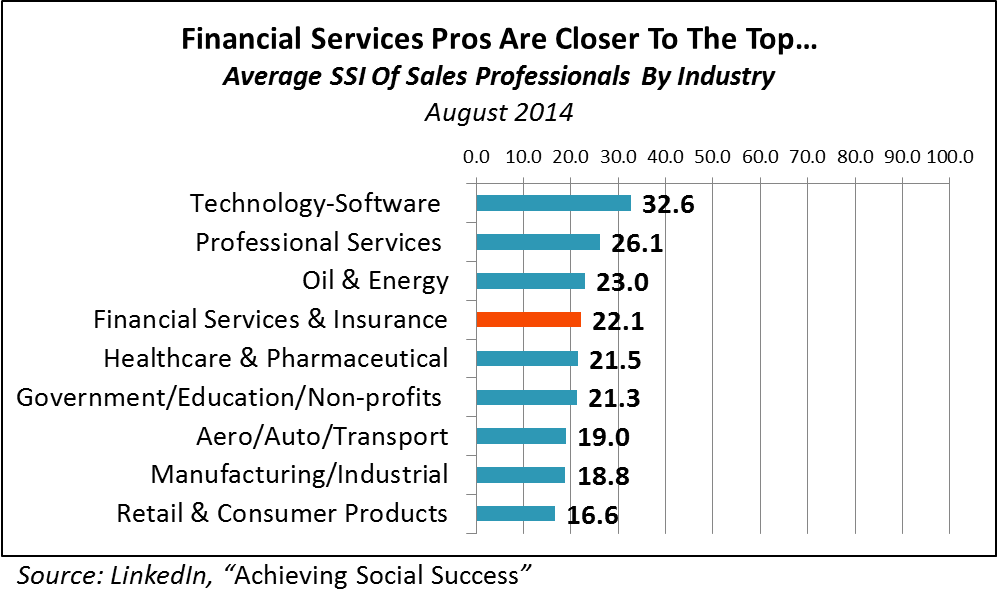
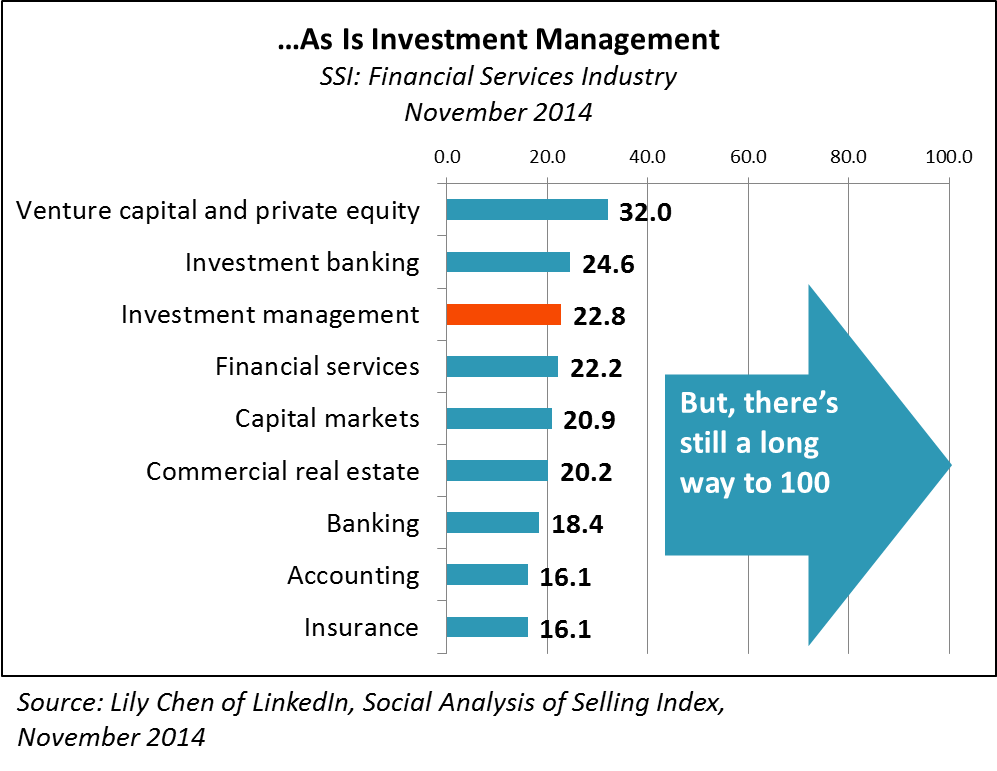
But as you can see from the all-industry and financial services charts below, SSIs today are quite low. Investment management sales professionals, even while near the top of the list, score 22.8 on a 100-point scale.

Industry SSIs
Financial Services SSIs

Marketers, before we go any further, let’s give it up for LinkedIn.

By developing the SSI benchmarking program, LinkedIn has documented a need that its Sales Navigator product can satisfy. They have found a way to drive adoption of a performance measure on which improvement is possible only by heightened use of their platform and their measurement tool.

Calling attention to these low scores suggests the opportunity ahead for those who commit to social selling (activities) and for LinkedIn, too. It's genius!

Success Stories

Just about a year in, there are some Sales Navigator success stories already being told.

The story most related to this business on LinkedIn’s case study page is about Guardian Life Insurance Company of America. A total of 250 agents took part in a pilot, growing their connections by 56%, performing 89,000 LinkedIn profile searches and selling insurance with a face value of $21 million. The PDF doesn’t comment on the agents’ SSIs and any movement there. Other firms including Bain, General Electric and PayPal also report success.

This is new and there are lots of questions not just about outcomes but implementation, which itself can be time-consuming and expensive for regulated investment firms. The Webinar I attended this week was co-hosted by Socialware and LinkedIn Sales Solutions, walking through some of the concerns (and available solutions). Here's the link to the replay, which I recommend you watch.

My great fascination with this program centers on the following:

  • Better rev up the engine. A heightened focus on sharing insights and building relationships within LinkedIn is going to mean much more activity aimed at the finite group of advisors, consultants and others who play a role in choosing and using investment products. 

Activity does not always translate to relevance, let alone effectiveness. Expect added pressure from your Sales partners to produce content and messaging that will help them achieve a healthy SSI.

  • A LinkedIn skew. As I understand it, the value of Sales Navigator is not just in the prospecting support, it’s in the management dashboard that enables trend analysis and coaching for social selling behaviors. Does this mark the beginning of a blend of in-house and outsourced sales performance evaluation?

It will be interesting to see how firms factor in the SSI with other performance measures as tracked by their CRMs. Will the availability of such a measure from LinkedIn and not from Twitter or Facebook (for advisory firms) result in a LinkedIn overweighting?

That would be a shame in my opinion. Twitter offers ample opportunity for friction-free interaction with advisors that could lead to off-line follow-up. I'd hate to see Twitter overlooked as wholesalers are increasingly empowered to establish their own social presence.   

  • Company-level data. LinkedIn is the financial advisors’ preferred network for the connections they can make, and asset managers gravitate to it for the visibility in front of both advisors and business professionals.

Enhancements made over the last few years by LinkedIn have supported opportunities to raise individual and brand awareness. Finding and connecting with individuals happens via powerful search filters that take advantage of how the collected data is architected.

What we don’t hear about anymore is the data that LinkedIn is collecting on companies. Do you recall the company profiles that were once published as a roll-up of all the individual profile activity? Below is a screenshot of the detail of a Google profile from the March 20, 2008, post introducing it. Promotions and changes, most popular employees, career paths, median age, median tenure—it was all there and it was awesome.

I remember once talking to a client tasked with keeping track of the number of CFAs on her firm's investment teams. “Ask LinkedIn, they keep better records on your employees than you do,” I joked. That's still true, more so, but they've stopped publishing it.

Today LinkedIn knows the SSIs of every wholesaler who has a profile on LinkedIn, as low as they might be.

It’s inevitable (and a welcome evolution, I agree) that social selling will become emphasized at investment firms. Firms’ use of Sales Navigator, theoretically driving up SSIs, will assure that LinkedIn will have a reliable map of who the best social sellers/LinkedIn power users are.

Now that's business intelligence, the result of imposing a standard performance measure. I wonder how businesses will get at it.

  • Publish the scores, LinkedIn! LinkedIn knows our social selling proficiency because it practices what it preaches—it pays attention to what members do on its platform. Given that our own account activity is the basis for the score, I wish LinkedIn would abandon its command and control approach to the data. There shouldn’t be any hoops for an individual member to have to jump through to see his or her score. 

I stand on principle on this, by the way. I harbor no illusions about my own no doubt anemic social selling score. But if LinkedIn were ranking asset management marketing consultants (and maybe they are), I'd be that much more worked up about this.

By now, companies making money on user-submitted data is common practice. Google Analytics (although free to most) set a precedent for entrusting your business’ Website data to a third party in exchange for the utility of the tool. Your data is always available to you, as is the benchmarking capability.

LinkedIn’s data is the result of its members contributing to it. I think the scores should be viewable in each account’s settings for all membership levels.

And what are your thoughts?

Are Fund Companies Becoming Invisible To Investors?

What if fund companies have been going about this all wrong?

What if the decision to focus on distribution as opposed to end-users has been a mistake?

What if years of business-to-business brand-building should have been directed at building a consumer brand?

What’s the future for product manufacturers whose users don’t know their names?

These are a few questions raised by research released Monday by Hearts & Wallets, a financial research platform for consumer savings and investing insights working with its database of 5,500 U.S. households augmented by focus group work.

“In a grave strategic error, investment product managers have allowed their offerings to become commoditized,” Laura Varas, Hearts & Wallets partner and co-founder, said.

Hearts And Wallets Product Awareness.png

Varas gets to this conclusion by pointing to data that shows a decline in product awareness across all lifestages. At the same time, awareness of asset allocation—something distributors provide—is increasing.

In 2010, 76% of U.S. households knew what investment products they owned.This year, 66% do—a 10 percentage point drop in five years.

The study Product Trends: Ownership, Allocations & Competitive Metrics, whichdetails product ownership trends and opportunities within all lifestage, wealth and age segments, finds that only 54% of the Mass Market could say what types of investment products—mutual funds, ETFs, individual bonds etc.—they own. That’s down 14 points from 68% in 2010.

“This trend is yet another sign of how product manager attentiveness to distributor needs, while ignoring consumers, has allowed retail financial distributors to gain the upper hand in satisfying the needs of the ultimate decision-makers–consumers,” says the press release headlined “Wake-Up Call for Investment Product Managers.”

Oh and also, the firm adds, “the loss of power among manufacturers is exacerbated by the white labeling trend in the defined contribution space. Investment menus are shifting from manager-branded portfolios to generically named options in which money management firms are virtually hidden from participants.”

Meanwhile, Distribution Awareness Is High

“We believe it behooves major investment companies for consumers to be aware whether or not they are shareholders, even if the products were selected by an advisor,” said Hearts & Wallets.

The firm measures this with a Shareholder Awareness score.Vanguard and Fidelity have the most aware shareholders—two-thirds of all shareholders are certain that they are those firms' shareholders. Among purely third-party distributed funds, American Funds leads with a 50% awareness score followed by BlackRock, which has built its score up to 47% from 41% in 2011.

Hearts  Wallets Toothpaste.png

By contrast, 90% of consumers nationally can answer questions about at least one “store”—which is how Hearts & Wallets refers to retail and defined contribution providers that work directly with investors. Just as a Cuisinart blender is available from Bloomingdale's, an American Funds fund might be available from an Edward Jones store or a BlackRock product from the Fidelity store, it explains to focus groups.

The focus group discussions yielded additional troubling insights.

"Participants said they once had expectations for product, but no longer did. And they said they felt most products are the same; products are not perceived as adding as much value as stores," the firm reports.

Even for a third-party distributed fund company, an “extreme degree of disconnection with the consumer” has many disadvantages, according to this explanation from Hearts & Wallets:

  • It puts the product managers entirely at the mercy of the “store.”
  • It deprives the consumer of knowing that the manager cares about them; many, if not all, of the managers care deeply about their shareholders.
  • It deprives product managers of the opportunity to engage with people who are aware of, and presumably interested in, their brand.

Making The Invisible Visible

IntelInside.jpg

On the flipside, marketers could no doubt list several arguments in favor of having a strong connection with users of their products.

Think of the legendary "Intel Inside" branding campaign that dates back more than 20 years. Its success in promoting the importance of a branded semiconductor chip (a commodity if there ever was one) in other manufacturers' computers powerfully drove sales and built brand loyalty.

Intel Inside inspired multiple subsequent “ingredient branding" efforts—what marketing professor Philip Kotler referred to as “making the invisible visible.”

You and your firm may want to review the Hearts & Wallets data. See whether it piques your curiosity about the level of your shareholder/investor awareness and its potential impact on your prospects for growth. The research prompted the following random thoughts from me this week.

The role of the relationship. As fascinating as I find the work and the conclusions, Hearts & Wallets' comparison of retail investment product distribution to consumer products and stores isn’t apples to apples. Toothpaste isn’t sold by anyone who seeks to have a relationship with the buyer. There’s a difference between the context of a consumer product transaction and an investment product selected for an outcome-oriented investment portfolio.

That said, I'm reacting to what I’ve seen that the firm has shared publicly. There’s more in the full study, which also includes “insight into innovative product solutions to help product manufacturers regain some balance with distributors.”

Content requires distribution, too. Embedded in asset managers’ reliance on others for product distribution is a reliance on others for content distribution. Every brand needs to distribute their content but investment brands especially so.

As I’ve commented on previously, mutual fund and ETF sites are product manufacturers’ sites. Their full product specs include information that other sites won’t. But, most product-related traffic goes to distributors’ and others’ domains.

It's just a consequence of today’s business model that when using thought leadership and other content to raise awareness and to demonstrate relevance, asset managers rely on others’ platforms to reach others’ audiences. As with product distribution, this makes firms dependent, can be costly and complicated, and subordinates the fund company brand.

A two-track approach. Let’s suppose that that you find a slide in your retail investor awareness and your firm is determined to reverse it. The effort would take at least two tracks: reaching current investors and reaching the public in general.

Together, omnibus accounts and overall intermediary pushback (i.e., who’s relationship is this, anyway?) present practical challenges to the prospect of elevating the brand to current investors. The greater opportunity will be with whatever marketing, media, public and community relations can accomplish.

Hearts & Wallets’ release recalled the 1990s when “high product awareness prompted consumers to seek out products like the Magellan Fund ofFidelity Investments, which was once the world’s best-known mutual fund.” That was the fund managed by iconic manager Peter Lynch.

For 2015—a disruptive time for every piece of retail investing from the products to the distributors/advisors to the users themselves—effective awareness-building would need to go beyond the promotion of a star manager or two.

Budget-busting. Any strategic decision to reach out to the retail investor would be an expensive one across the board. Brand and advertising is already the largest percentage of asset management marketing budgets, according to SwanDog Strategic Marketing benchmarking work. But most firms today focus on media that helps them reach 300,000 financial advisors. Add retail investor-focused ad buys, inbound marketing, analytics, etc. and you are talking big money.

An ETF advantage? This data would seem to temper what we can expect from mutual fund firms that are getting into the exchange-traded fund (ETF) business. Product awareness is a prerequisite to brand loyalty or brand affinity. If awareness is low, the fund company new to marketing ETFs, whether to advisor-assisted or self-directed investors, may be diversifying product lines with less of an advantage than it realizes.  

A shift in the power dynamic. Who in the typical intermediary-focused organization best knows the consumer? The people who answer shareholder inquiries and (wait for it) those who've recently become involved with the listening and responding responsibilities of social media. A serious commitment to pay attention to consumers would require the building out of resources, conceivably shrinking—even if just a bit—the influence of the wholesale sales organization.

Regarding social media, specifically: Given access to platforms with millions of consumers, is it a miscalculation for firms to instinctively want to fence off an account or area with content directed at advisors? I'm beginning to wonder.

Your thoughts?
Let’s Try To Be Less Predictable

It’s a busy and emotional week for me as my nephew, godson and personal hero to many, me included, graduates from medical school. A sick boy becomes a doctor? Don’t get me started.

The long and winding posts will resume next week, I've decided to keep it short today. Enjoy while you can!

Briefly, I call your attention to the StockCats Stock Market Headline Generator v1.0, which aims to simplify the creation of the stock market narrative provided by many in the investment industry, including mutual fund and ETF marketers.

Below is a screenshot showing the choices available in just one of the seven provided dropdown boxes. You need to click through to the site (one page, really) to drink in just how predictable investment communicating can be.

Let's face it: Many of our market (and other) communications teeter on the brink of Yada Yada Yada. This is Exhibit A in the case to be made in favor of thoughtful, differentiating, even inventive content. Godspeed.

BlackRock Explains Its Sponsored Update Success

One of the best things a company can do is show its customers how other customers are using its products. Have you ever seen the GoPro videos?

Logo-2C-75px-R.png

Even though Twitter, Facebook and YouTube aren’t business-to-business platforms, I wish they’d support the financial services user group, as LinkedIn does. Most social stuff does not come naturally to finserv marketers, and the world isn’t necessarily waiting for socially shared financial content. A little help can go a long way in maximizing what can be large budgets and promising careers.

While we wait for the others to step up with specialized training, LinkedIn continues on its merry way producing events (such as FinanceConnect happening this week in New York and today online), ebooks (see The Sophisticated Finance Marketer Vol. 2: Balancing Real-Time News with Planned Editorial Content) and Webinars.

The latest of the Webinars—How BlackRock Became A Sponsored Updates Superstar—was held yesterday afternoon. I've embedded the 57-minute presentation below.

This isn’t all benevolence on LinkedIn’s part, of course. In its earnings announcement last week, the firm reported that Sponsored Updates, its primary content marketing product, account for more than 40% of its overall Marketing Solutions revenue of $119 million.

That’s a big improvement for the quarter (although Marketing Solutions revenue overall was down from the fourth quarter of 2014), helped along by the growing content consumption on LinkedIn and the acquisition and integration of Bizo. Despite LinkedIn’s legacy as a job-hunters site, there’s eight times more engagement with content on the site than with jobs, according to yesterday’s Webinar moderator Senior Global Product Marketing Manager Selin Tyler.

But this slide from the LinkedIn Market Opportunity deck (this link opens a PDF) will give you an idea of how LinkedIn sizes the opportunity. There’s more to go.

Content That Serves A Purpose

In this space, LinkedIn is marketers’ top social focus, largely because that’s what the majority of financial advisors are paying attention to. Every mutual fund and exchange-traded fund (ETF) firm can establish a LinkedIn company page, post organic updates to it and hope to build followers and engagement. And, that will go so far. Those with a promotional budget can access LinkedIn’s sponsored updates for greater, targeted reach and visibility.

What can be expected of a sponsored update program? LinkedIn asked none other than BlackRock, one of its pioneering firms in the program since 2013, to sit for a Q&A.

Ann-Hynek-Lauren-Suslow.png

I recommend this discussion to you not for its support of a LinkedIn product but for the insights provided on how to “craft” (a word used often) and manage content created for a purpose. It’s obvious that presenters Ann Hynek, managing editor of the BlackRock blog, and Lorin Suslow, social media marketing strategist in charge of the LinkedIn paid media program, have thought every detail through. Whether you’re a sponsored update advertiser or an organic update publisher, you’re likely to benefit from this discussion. My takeaways follow.

Planning

BlackRock sponsored updates are sourced from the BlackRock blog, which is by far the most prolific blog in the industry (and the most aggressive about seeking comments—see this post). Its focus is on investor education, retirement and pending market events that support BlackRock’s objective of raising retail awareness. Products are typically not mentioned.

Sometimes within firms, there can be tension between the editorial function of a blog and the needs of those in advertising. Suslow described a content planning collaboration that optimizes what’s needed for marketing. In addition to delivering on educational goals, content created needs to support the BlackRock and iShares brand themes. She looks at the available evergreen content and the planned content and performs a gap analysis, the result of which may require going back to Hynek and the blog contributors with additional requests.

Last year’s campaigns performed at four times the benchmark, Suslow said, due to the quality and variety of content offered via the sponsored updates.

Targeting

BlackRock’s best-performing sponsored update, shown below, produced 10 times the average CTR. I should say that I cobbled this screenshot together based on the organic update I found in BlackRock’s feed from November 2014. I’m not the audience BlackRock would have been targeting. What firm wouldn’t have been happy with the number of organic likes and comments shown on this update?

TopBlackRockSponsoredUpdate.png

Such engagement is a function of reach and, to some extent, the number of followers. BlackRock uses sponsored updates to amp up both. The precision targeting available to target financial advisors and other professionals and/or people in key life stages are what drives the engagement “much higher” than on the organic updates, Suslow said.

Next up for BlackRock: Suslow said the firm soon will be using LinkedIn’s new Lead Accelerator. Lead Accelerator is a remarketing-like product using LinkedIn display and social ads, including sponsored updates, to nurture BlackRock Website visitors as they traverse the Web.

The Composition Of An Update

Pay attention to these marketers’ comments on the consideration given to each element of the update, and the continual adjustment, including A/B testing, involved. When something’s not working, they say, 90% of the time it’s the headline that needs help. It’s the content just 10% of the time, often involving updates that mention product.

Analytics

Suslow says she checks on the program’s performance twice a day. LinkedIn-provided analytics include impressions (is the target audience large enough?), engagement rate (a measure of campaign health and ad content health) and performance relative to the update benchmark. Each post is ranked as a strong performer, viral performer or poor performer.

Given that the updates all link to BlackRock’s blog, Web analytics are no doubt part of the performance analysis, although nothing was shared about that. I also would have liked to have learned about their analysis of likes, comments and shares, and the effect of influencers on virality.

Engagement Leaders And Popular Topics

Toward the end of the hour, program moderator Tyler walked through a few slides showing the best-performing sponsored updates of the quarter.

TopicsFinancialAdvisorsEngageInOnLinkedIn.png

OppenheimerFunds, Goldman Sachs and Merrill Lynch were among the leaders, ranked by engagement rate.

She also shared a list of topics producing the most engagement (clicks+likes+comments+shares) among financial advisors in the first quarter of 2015.

A First Look At Fund Website Benchmarking Data

Digital marketing success isn’t defined in terms of Website traffic. There’s so much else to consider.

However, benchmarking data on the overall level and composition of your site traffic vis-à-vis your competition can be useful. You’re appealing to the same broad audiences, and their behavior on related sites should have some meaning for you.

This is a follow-up to last October’s post about the return of benchmarking to Google Analytics. Now there's data to analyze! Here's a first look at it.

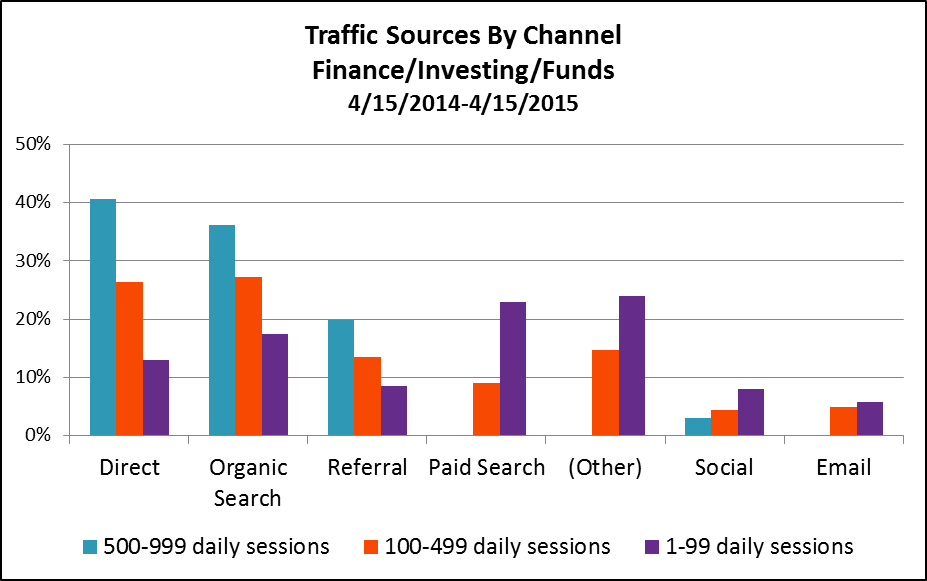
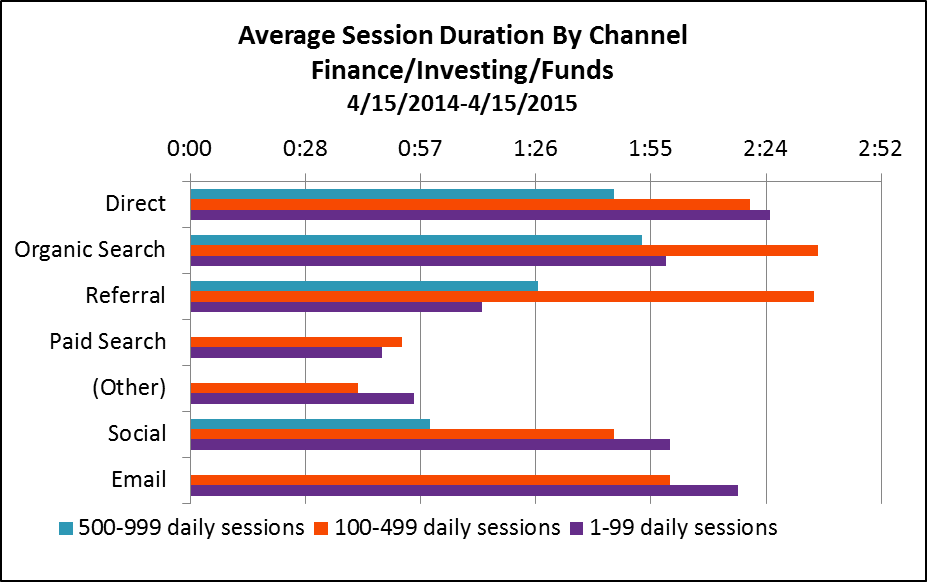
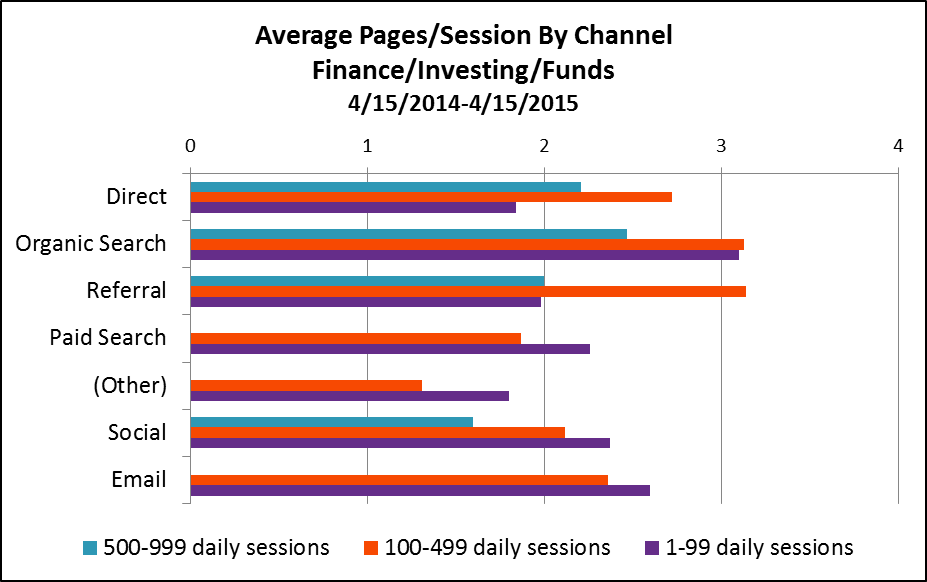
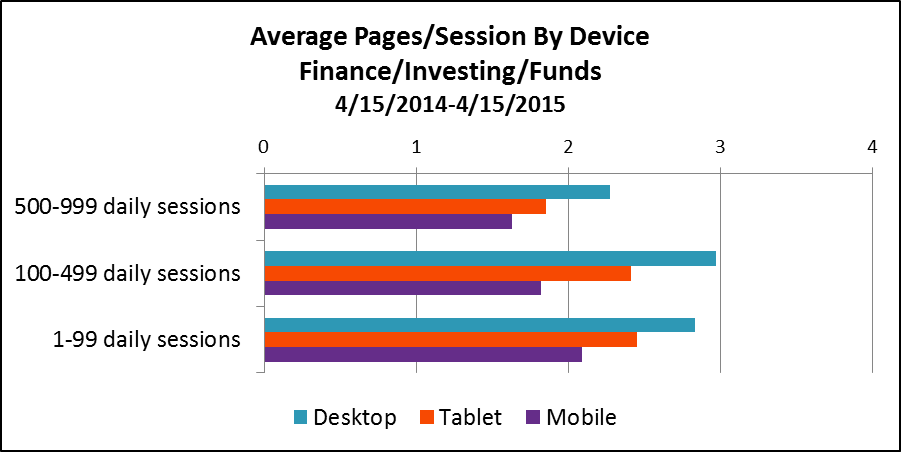
The graphs below reflect 12 months of activity (April 15, 2014-April 15, 2015) on 426 fund Websites whose firms have opted in to share anonymized data to enable benchmarking.

The sites are grouped by number of daily sessions, and the data in the graphs are based on three groups: 0-99 daily sessions (sample=377), 100-499 daily sessions (sample=29) and 500-999 daily sessions (sample=20). Google doesn't yet have a large enough sample to report on fund sites with 1,000 daily sessions and more.

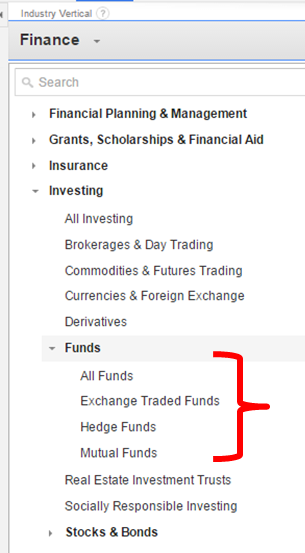
All data can be found in your Google Analytics account. Just go to Audience/Benchmarking. I looked at data at the Funds level (including mutual funds, exchange-traded funds [ETFs] and hedge funds), exported in Excel spreadsheets to be able to work with it.

This is more real (not based on user panels but on actual data that Google is collecting on sites) and more granular (most free benchmarking services stop at Finance or Investing in general, which includes brokerage sites).

Still, the benchmarking will be even more useful:

  • When mutual fund and ETF site benchmarking data is able to be reported separately. That can’t happen until a sufficient number of properties agree to contribute data. If your firm hasn't yet opted in, you might want to consider. More on that in my previous post.
  • When some category inconsistencies are addressed. Google has no trouble recognizing direct, search (organic and paid), referral and even social traffic. But if site publishers aren’t using tracking code to distinguish between display and email traffic, Google may mis-categorize it as direct traffic data. You’ll see below that Google benchmarking data is being reported for paid search, other paid traffic sources and email for the less trafficked sites but not for the most trafficked sites.
  • When you isolate your own peer group and delve in. I’m presenting the three groups together to get a high level sense of fund company Website traffic in 2015. Compare your site's traffic to your peer group and you’ll learn more.

A Few Takeaways

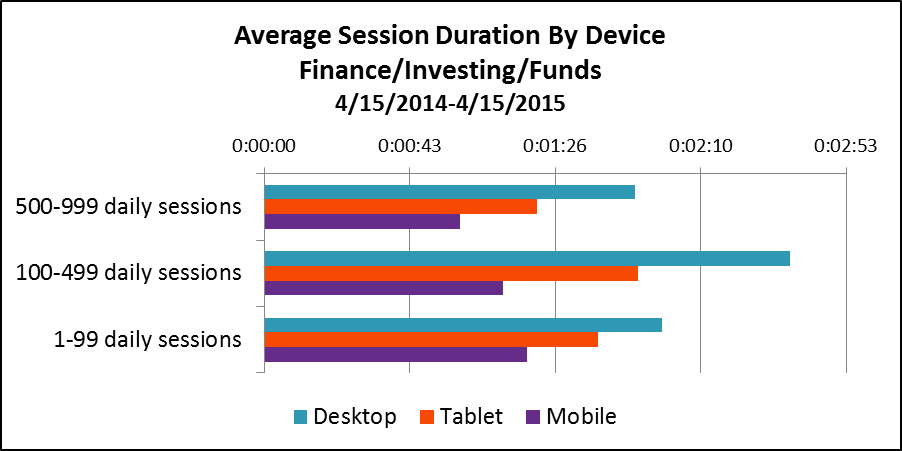
1. Overall, it looks as if the most that a fund site can hope for are a couple of minutes of the visitors’ time and a couple of pages viewed. This data suggests—let me amend that—makes the argument for easy-to-find content on sites that anticipate the task-oriented visitor. They come, they get, they go. Not that there's anything wrong with that.

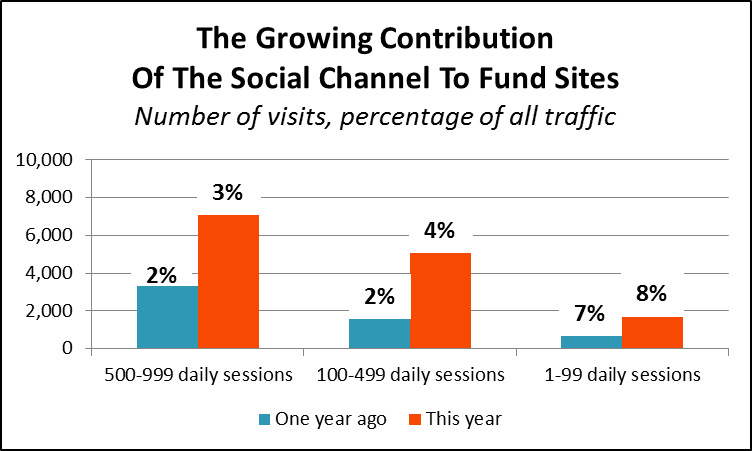
2. Finally, we have data on the contribution being made by social efforts and by email—two areas that there is great interest and investment in.

In fact, see the growth in the total number of sessions driven by social in the most recent 12-month period over the previous period. Benchmarking data is available only from August 28, 2013, so the earlier period comparison is from 8/28/2013-4/14/2014, eight months versus 12.

3. Direct traffic (a reflection of brand awareness and product familiarity), organic search (a measure of content availability, quality and accessibility) and referral links drive the better trafficked Websites. Less trafficked sites rely on paid search, other advertising and organic search.

4. There’s a difference in the traffic sourced by each channel: Direct traffic, organic search and referrals lead to more longer-duration sessions, with more pages viewed.


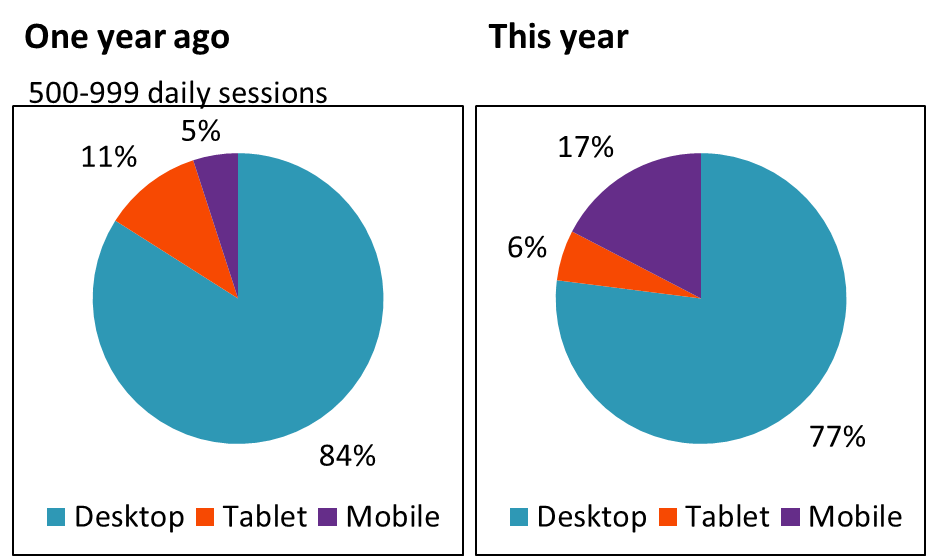
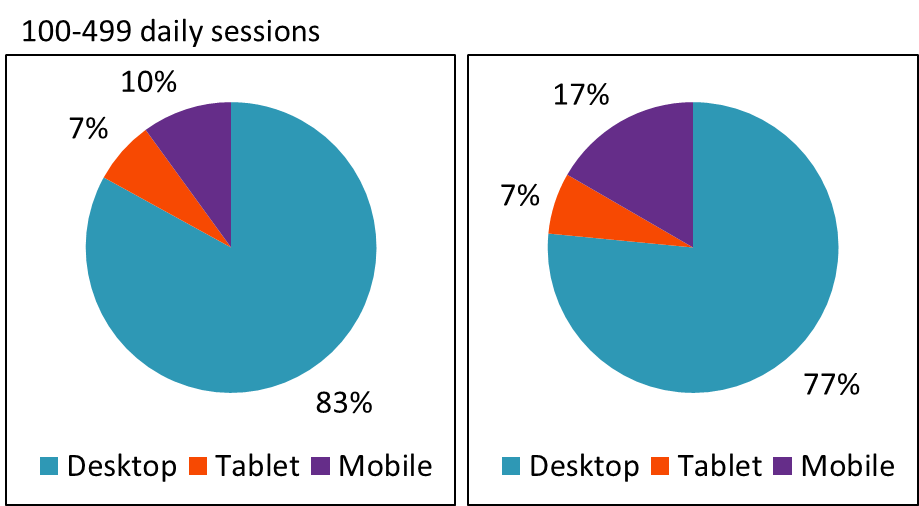
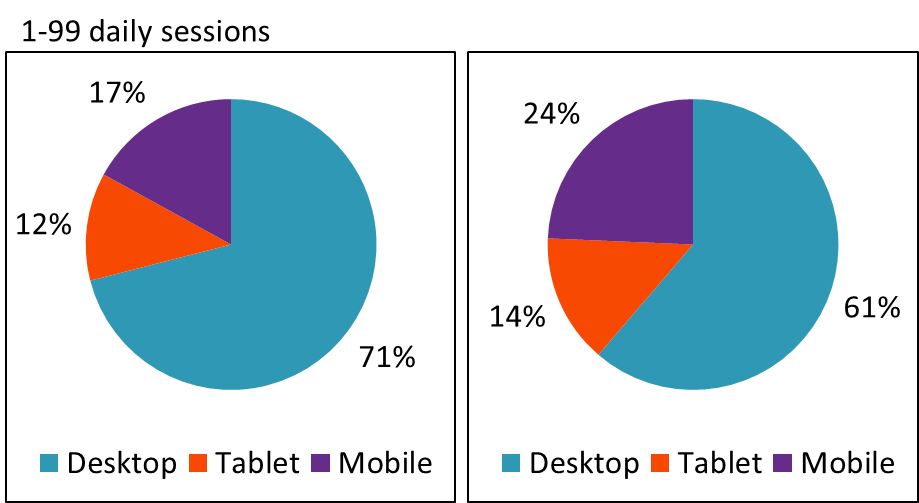
5. Just about one out of four visitors to fund sites comes from non-desktop devices (e.g., tablets or smartphones). This is a remarkable change that has undeniable implications for sites created for desktop use.  

6. Desktop sessions last longer than mobile sessions, which is to be expected. But, there isn’t a big difference in the number of pages viewed across devices. Here too, it’s few pages across the board.

Drilling into your firm’s analytics will help you understand whether this is a good or bad thing. It’s good if you can see that visitors are immediately finding what they need and then moving on. Not so good if the short visits point to visitors—even more frustrated because they're on smaller screens and possibly on the go—who give up.


An Over-The-Shoulder Look At Advisor Sites

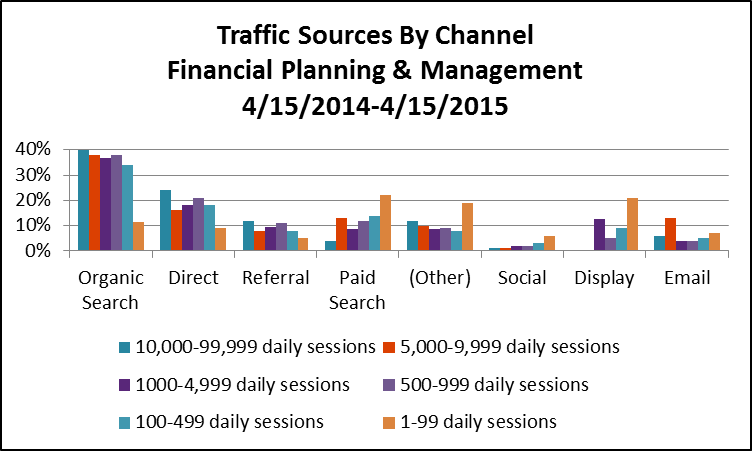
Out of curiosity, I also looked at the benchmarking data of sites that are in the Financial Planning & Management category, which together represent about 6,800 Web properties. Nine out of 10 of these attract fewer than 100 daily sessions. Google reports data on sites attracting as many as 10,000-99,999 sessions.

Make no mistake about it—many financial advisors are turning to the same content marketing and paid search tactics that asset manager sites use to build awareness and drive interest. I spotted certified financial planner Jeff Rose ranking for "Roth IRA" searches back in 2010, and more advisors have gotten more serious about inbound marketing since. (In fact, see FMG Suite’s 2015 Inbound Marketing award winners—there are some impressive marketers on that list of financial advisors.)

Few advisory firms may enjoy the brand recognition of your firms or the marketing budgets. The benchmarking data gives us an idea of the organic search strength among financial planning sites.

And there's more—but I'll leave the rest for you to explore.